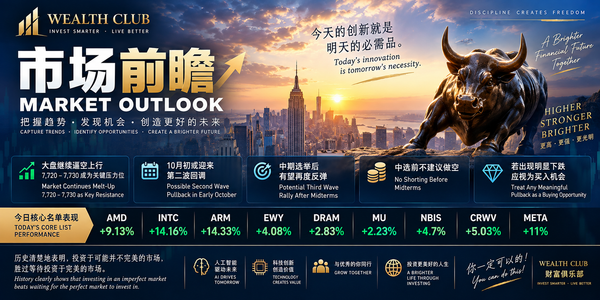
科技板块回调非危机:AI资本开支周期未完待续 Tech Pullback, Not Crisis: The AI Capex Cycle Continues

你好,希望你今天一切都好。
Hello, hope you're having a great day.
早盘交易呈现分化格局,标普500指数收红转跌,而道琼斯指数则维持在绿色区间。
In this morning's session, markets showed a mixed picture — the S&P 500 dipped into negative territory while the Dow Jones held gains.
浏览近期市场报道,官方普遍将半导体与人工智能相关股票的回调解读为典型的板块"轮动"。团队认为这一说法并不准确。
Scanning recent market coverage, the prevailing narrative frames the pullback in semiconductor and AI-related stocks as a classic sector "rotation." Our team believes this framing misses the mark.
轮动理论假设市场是零和博弈——资金从科技股流出后,必然流入价值股、股息股或债券,随后再流回科技股。但市场运作的实际逻辑并非如此简单。
The rotation theory assumes markets are a zero-sum game — capital flowing out of tech must flow into value stocks, dividends, or bonds, then eventually cycle back. But that's not really how markets work.
随着价格涨跌,市场持续创造新的利润并吸引新增资金,这也是为何历史数据清楚显示,长期投资回报最终会超越短线交易收益。
As prices rise and fall, markets continuously generate new profits and attract fresh capital — which is why history clearly shows long-term investing outperforms short-term trading over time.
举例来说,若仅考虑未来24小时,收盘上涨的概率与抛硬币相差无几;若愿意持有3至5年,概率跃升至约80%;持有十年,概率超过90%;持有二十年,则几乎接近100%。
To illustrate: over the next 24 hours, the odds of a positive close are close to a coin flip. Hold for 3–5 years, and the odds jump to roughly 80%. Over ten years, they exceed 90%. Over twenty years, they approach nearly 100%.
许多投资者常表示自己没有那样的"时间",但这并不会改变数据本身——真正改变的,只是你所关注的时间维度。无论投资者年龄多大,今天投入的每一美元,都拥有相同的预期长期回报。
Many investors say they don't have that kind of "time," but that doesn't change the underlying math — what changes is simply the timeframe you're focused on. Regardless of age, every dollar invested today carries the same expected long-term return.
赌场游戏刻意围绕短时间设计——转盘、发牌、掷骰,因为庄家优势依赖快速决策与小样本才能生效。市场的运作逻辑恰恰相反:持有时间越长,胜算越是向投资者、资金以及长期财富积累倾斜。
Casino games are deliberately built around short time horizons — spins, hands, rolls — because the house edge depends on quick decisions and small sample sizes. Markets work in the opposite direction: the longer you stay at the table, the more the odds tilt in your favor.
📉科技板块回调背景
📉Tech Pullback in Context
科技板块自六月高点已回落8%。回顾过去十年表现:2025年+24.9%,2024年+24.9%,2023年+57.5%,2022年-28.4%,2021年+37.0%,2020年+41.0%,2019年+49.8%,2018年-2.9%,2017年+33.1%。
Tech has pulled back 8% from its June highs. Looking at the past decade: 2025 +24.9%, 2024 +24.9%, 2023 +57.5%, 2022 -28.4%, 2021 +37.0%, 2020 +41.0%, 2019 +49.8%, 2018 -2.9%, 2017 +33.1%.