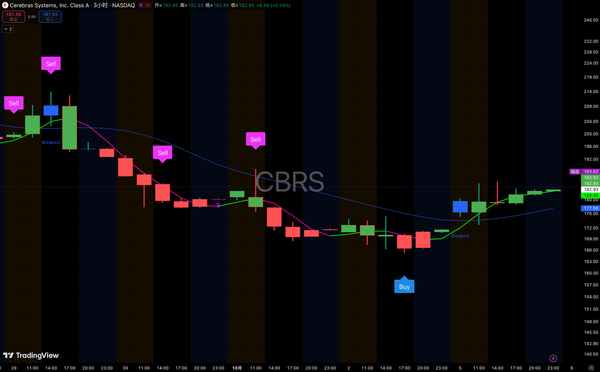
恭喜会员!NVDA 170→240,会员收益约41% $170→$240, Members Up ~41%
🎉 恭喜我们3月在 $NVDA 约170美元附近完成布局、并一直持有到现在的会员!今天英伟达再次刷新历史新高,盘中最高来到约 240美元。从我们当时约170美元附近的建仓位置计算,到今天最高240美元附近,阶段涨幅约41%! 这一段上涨幅度已经相当可观。更重要的是,这不是股价涨上去之后才回头说“我们早就看好”。当时的建仓时间、交易逻辑、量化信号以及后续持仓过程,全部都有完整记录,会员可以在平台随时回看、核对。
🎉 Congratulations to all our members who built positions in $NVDA around $170 back in March and have continued holding until now! Nvidia has once again reached a new all-time high today, with the share price climbing to around $240 intraday. From our entry area near $170 to today’s high around $240, that represents a gain of approximately 41%. More importantly, this is not a case of looking back after the stock has already risen and claiming that we were bullish all along. Our original entry timing, trading rationale, quantitative signals, and the entire holding process have all been fully documented on the member platform for members to review and verify at any time.
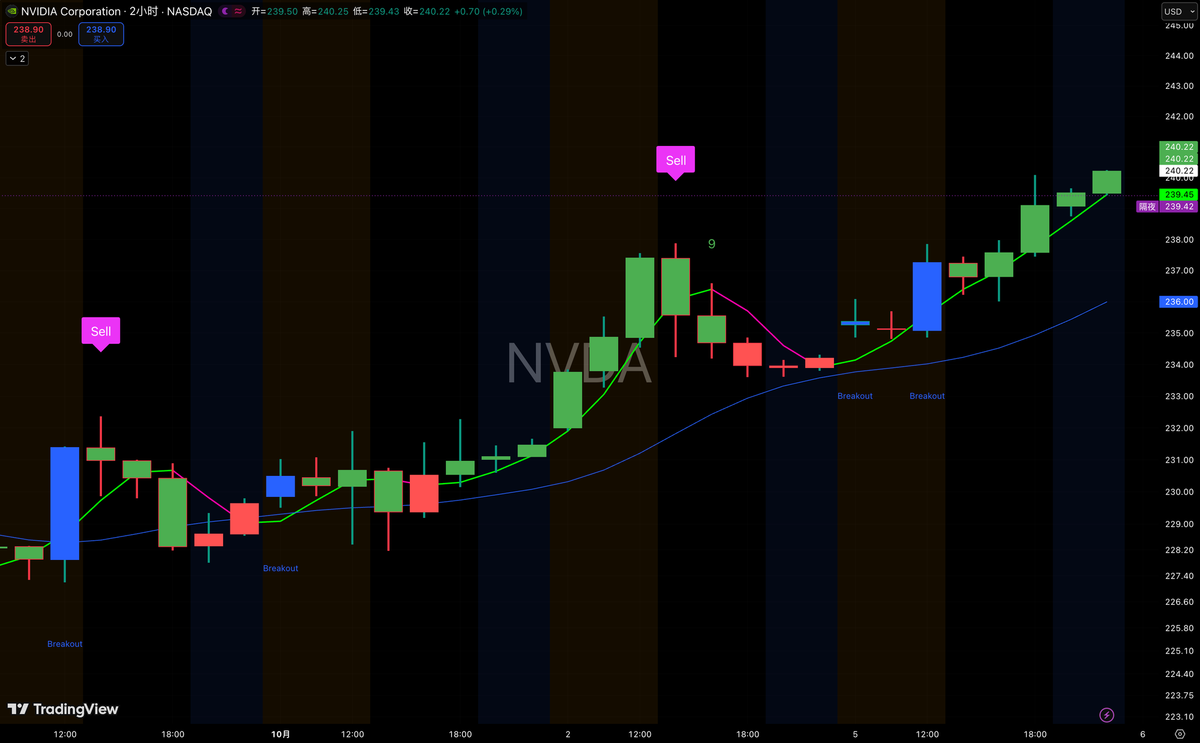
而这段行情也不是一路直线上涨。中间其实经历过多次震荡,系统也并不是一路只给“持有”。从图上可以看到,当价格出现阶段性高位、短线结构开始转弱时,系统及时给出了 Sell 卖出信号,帮助做中短线的会员在相对高位锁定部分利润。随后,当调整结束、结构重新转强,系统又再次出现 Breakout 突破信号。之后股价重新启动,从约234–236美元一带继续向上,最终再次站上240美元附近并刷新历史新高。
This rally was not a straight line higher. There were several periods of volatility along the way, and our system did not simply keep telling members to “hold” throughout the entire move. As shown on the chart, when the stock reached a short-term high and the technical structure began to weaken, the system generated a Sell signal, helping short- and medium-term traders lock in profits at relatively elevated levels. Later, once the pullback ended and the structure turned bullish again, the system produced another Breakout signal. The stock then resumed its advance from roughly the $234–$236 area and went on to reclaim the $240 level and set another all-time high.
所以这段行情,其实同时验证了两套逻辑。对于长期投资者来说,从170美元附近一路持有到今天,阶段涨幅约41%;对于中短线交易者来说,则可以根据Sell与Breakout信号,把握中间的高位减仓、回调后的重新突破,进行波段操作。这正是我们交易系统真正想解决的问题。它不是告诉你一只股票“永远涨”,而是在不同阶段帮助你识别什么时候趋势开始启动、什么时候突破得到确认、什么时候短线风险增加、什么时候应该保护利润,以及什么时候重新出现新的上升机会。
This move has effectively validated two different trading approaches at the same time. For long-term investors, holding from around $170 to today has produced a gain of roughly 41%. For short- and medium-term traders, the Sell and Breakout signals offered opportunities to reduce exposure near short-term highs, protect profits, and re-enter when the structure strengthened again. This is exactly what our trading system is designed to do. It is not there to tell you that a stock will “always go up.” Instead, it helps identify when a trend is beginning, when a breakout is being confirmed, when short-term risk is increasing, when profits should be protected, and when a new upside opportunity may be emerging.
很多投资者真正的问题,并不是不会找到好公司,而是看对了,却拿不住。涨一点就卖,跌一点就慌,突破时不敢买,回调后又不知道该不该重新进场,最后明明方向判断正确,却没有真正吃到整段趋势。所以我们一直强调:好的交易,不只是选对股票,更重要的是选对位置、看懂结构、按照系统执行。 这次 $NVDA 从约170美元到240美元、约41%的阶段涨幅,就是一个非常完整的案例。
For many investors, the real problem is not finding good companies. The problem is being right about the stock but failing to stay with the trade. They sell after a small gain, panic after a small pullback, hesitate when a breakout occurs, and then become unsure about re-entering after a correction. In the end, they may have identified the right company but still fail to capture the full trend. That is why we always emphasize: successful trading is not only about choosing the right stock; it is also about choosing the right entry, understanding the structure, and executing with discipline. Nvidia’s move from around $170 to $240, a gain of roughly 41%, is a very complete example of this process.
而且所有操作记录、时间点、信号和逻辑,都已经保留在会员平台。不是事后截图,也不是涨完之后才复盘,而是在行情发生之前和发生过程中,系统已经不断给出提示。🎉 再次恭喜所有从3月约170美元附近一路持有到现在的会员,也恭喜利用系统把握中间波段机会的朋友。
All of our trading records, timestamps, signals, and underlying logic have been preserved on the member platform. These are not screenshots created after the fact, nor are they retrospective explanations made only after the stock has already risen. The signals were generated and documented before and during the move itself. 🎉 Once again, congratulations to all members who have held from around $170 since March, and also to those who used the system to capture the intermediate swing-trading opportunities along the way.