Force · 多空动能交易系统 · Force Trading System

【Sub Chart】
市场里有两股力量在持续拉锯。看见它们的人,永远不会被趋势突袭。
Two forces are constantly pulling against each other in the market. Those who can see them will never be caught off guard by a trend.
趋势不是无缘无故出现的。在价格大幅移动之前,多空两方的力量对比早已发生了变化。Force 多空动能交易系统由财富俱乐部量化分析团队打造,把多空两方的动能变化实时可视化——用两条轨道之间的填色空间,直接告诉你现在谁占优势,谁在退场。
Trends don't appear out of nowhere. Before price makes a big move, the balance of power between bulls and bears has already shifted. The Force Trading System, built by the Wealth Club quantitative analysis team, visualizes the dynamic changes in bull and bear momentum in real time — using the color-filled space between two tracks to tell you directly who has the advantage and who is retreating.
无需成为图表专家,强大的算法自动为你绘制所有关键信息。适用于股票、加密货币、外汇和商品等任何金融市场,支持 1m、5m、15m、1h、4H、1D 等所有主流时间框架。无论你是日内交易者、波段交易者还是趋势交易者,Force 都能为你实时呈现多空力量消长,让你像机构一样进行交易。
No need to be a chart expert. Our powerful algorithm automatically plots all key information for you. Compatible with any financial market — stocks, crypto, forex, and commodities — across all major timeframes including 1m, 5m, 15m, 1h, 4H, and 1D. Whether you're a day trader, swing trader, or trend trader, Force presents the real-time bull-bear momentum shift so you can trade like an institution.
这套系统做了什么?What does this system do?
财富俱乐部量化分析团队通过以下四个维度构建这套系统:
- 深度量化研究公司财务数据
- K线与趋势技术指标分析
- 机构主力资金流向监测
- 大数据与AI驱动的多因子模型
The Wealth Club quantitative analysis team built this system across four dimensions:
- In-depth quantitative research of company financial data
- Candlestick and trend technical indicator analysis
- Institutional capital flow monitoring
- Big data and AI-driven multi-factor model
在上述四个维度的基础上,Force 系统额外整合了趋势加速度模型(Trend Acceleration Model)与动能衰减预警指数(Momentum Decay Warning Index)。前者通过计算价格动能的一阶与二阶导数,精确衡量趋势推进的速度与加速度——这正是量化对冲基金在评估趋势强度时使用的核心数学框架;后者则在动能开始减速但尚未反转时率先给出预警,让你在趋势真正衰竭之前就做好风险管理准备。
In addition to the four core dimensions, the Force system further integrates a Trend Acceleration Model and a Momentum Decay Warning Index. The former calculates the first and second derivatives of price momentum to precisely measure the velocity and acceleration of trend progression — the core mathematical framework used by quantitative hedge funds when assessing trend strength. The latter issues an early warning when momentum begins decelerating but has not yet reversed, giving you time to manage risk before the trend fully exhausts.
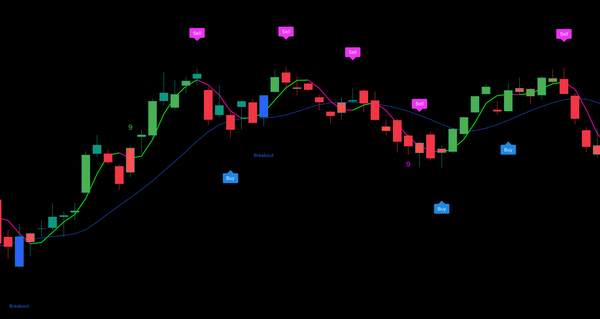
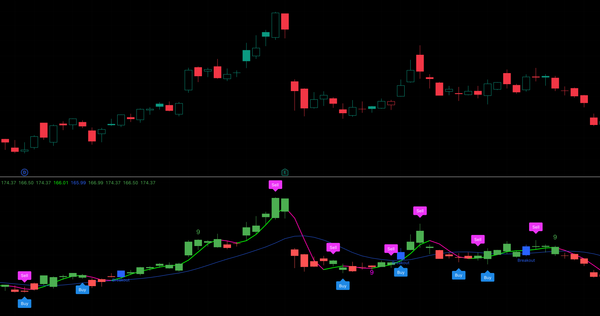
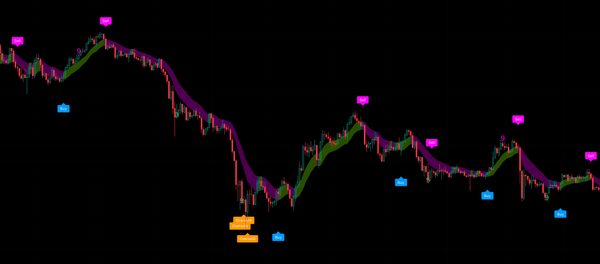
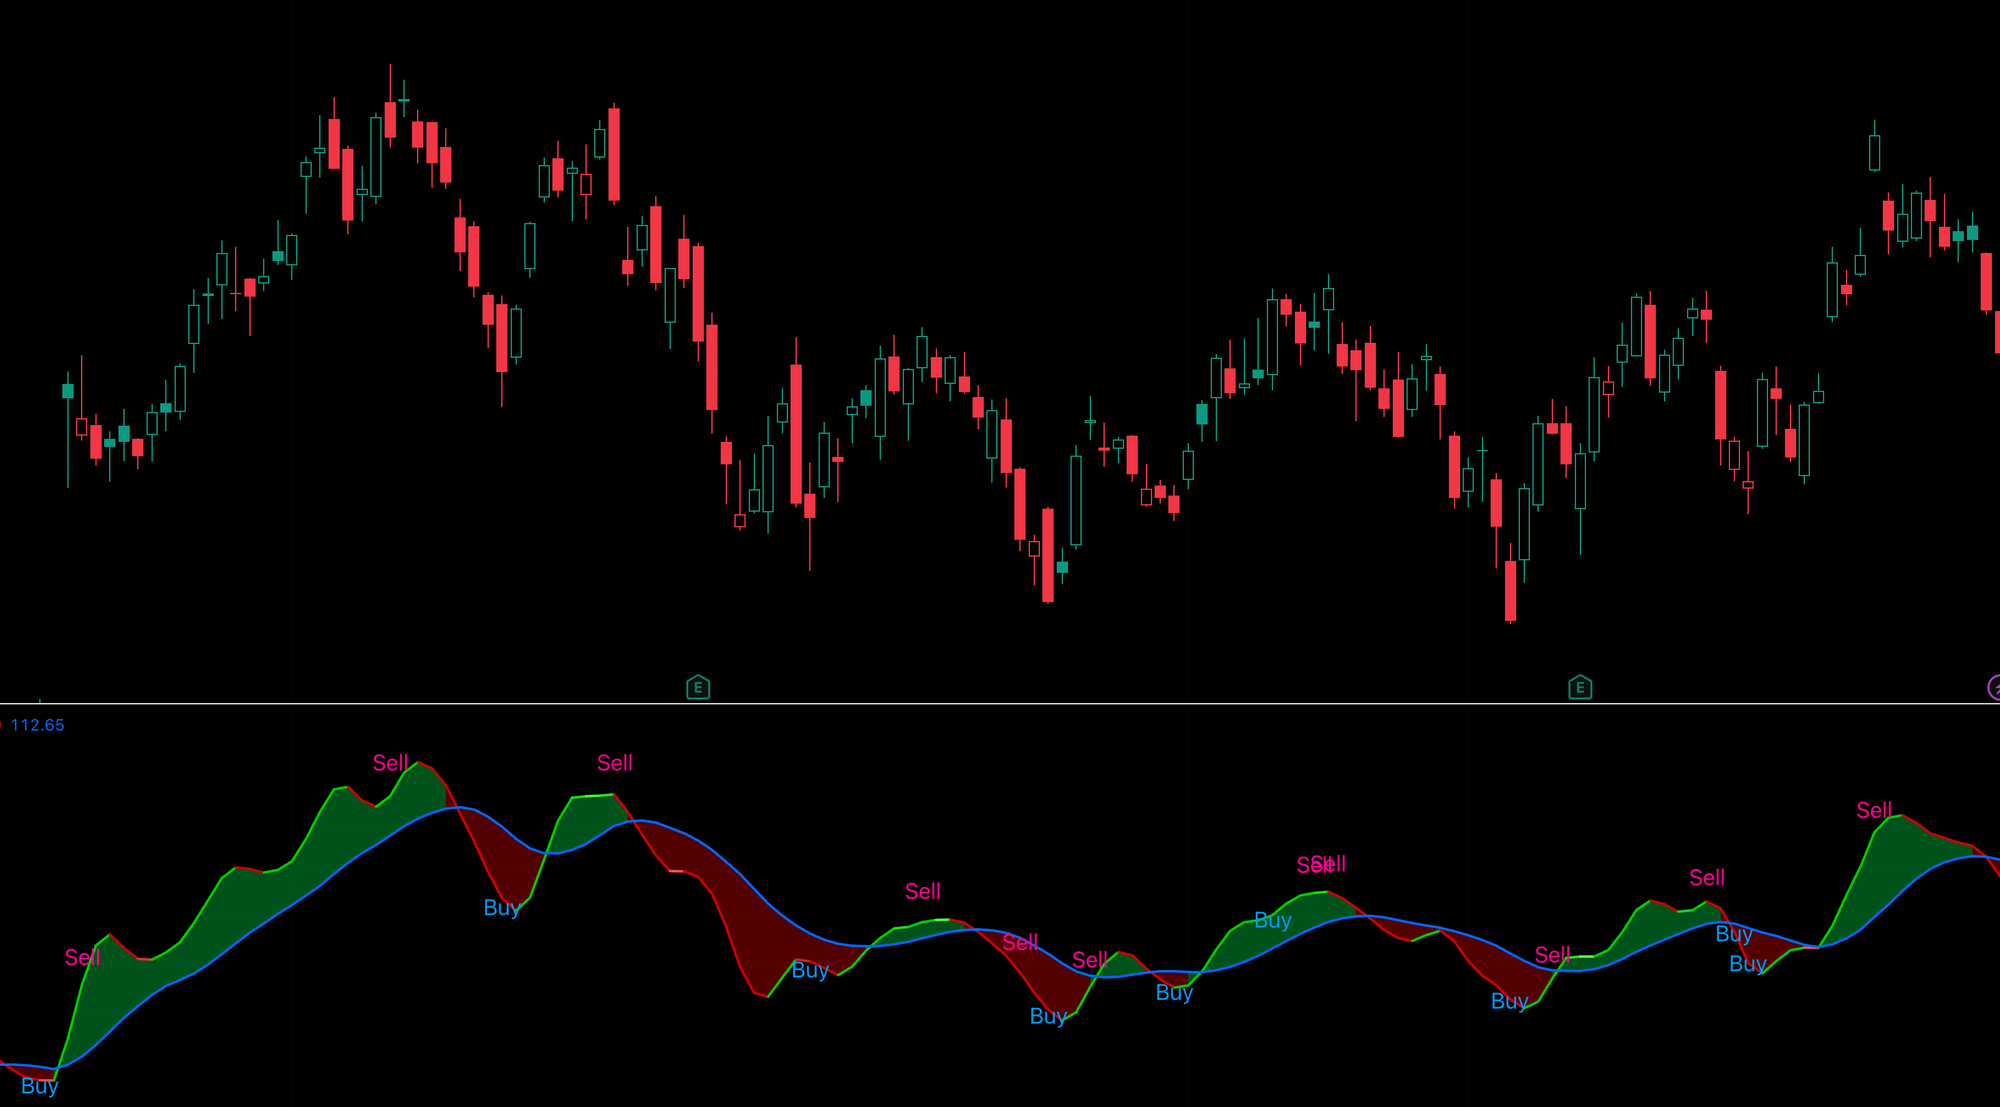
Force 在副图上显示两条量化动态轨道,轨道之间的空间用颜色填充。当多头动能占优,填色空间变为绿色,轨道向上扩展,系统自动标出 BUY 信号;当空头动能接管,填色空间转为红色,轨道向下收窄,系统自动标出 SELL 信号。
Force displays two quantitative dynamic tracks on the sub-chart, with the space between them filled with color. When bullish momentum dominates, the fill turns green and the tracks expand upward — the system automatically marks a BUY signal. When bearish momentum takes over, the fill turns red and the tracks contract downward — the system marks a SELL signal.
最终呈现在你面前的,只有两件事:图表上的 BUY,和图表上的 SELL。
What's presented to you is simple: BUY on the chart, and SELL on the chart.
订阅后即可解锁 Force 完整使用指南,包括:
- 填色空间转色时的具体进场和离场操作
- 哪个时间周期效果最好,日线、周线、小时线各有什么不同用法
- 如何判断填色空间的扩大和收窄,代表完全不同的市场信号
- 止损位如何设置,以及为什么严格止损的交易者长期一定比不止损的赚得更多
- 如何配合其他指标使用,形成更高胜率的交易系统
- 如何在 TradingView 上获得这个指标的专属授权,直接在你自己的账户上实时使用
Subscribe to unlock the complete Force usage guide, including:
- Exactly how to enter and exit when the color fill changes
- Which timeframe works best — how daily, weekly, and hourly charts each serve a different purpose
- How to judge the expansion and contraction of the color fill — they represent completely different market signals
- How to set stop-losses, and why traders who cut losses strictly will always outperform those who don't over the long run
- How to combine with other indicators to build a higher win-rate trading system
- How to obtain exclusive TradingView access to run this indicator live in your own account
订阅会员还可获得完整访问权限,包括:
• 交易机会报告
• 深度研究报告
• 潜力名单
• 核心名单
• 18套专业交易系统完整使用权:
• QuantFlow Trading System. 量化流交易系统 【主图】
• Trail Trading System. 轨迹信号交易系统 【主图】
• Dot Trading System. 点位信号交易系统 【副图】
• Apex Pro Trading System. 巅峰交易系统 【主图】
• Apex Trading System. 顶点交易系统 【主图】
• Rainbow Trading System. 彩虹趋势交易系统 【副图】
• Force Trading System. 多空动能交易系统 【副图】
• Radar Trading System. 雷达交易系统 【副图】
• Flow Trading System. 顺势交易系统 【副图】
• Duel Trading System. 多空对决交易系统 【副图】
• Zone Trading System. 热度预警交易系统 【副图】
• Sigma Trading System. 顶底捕捉交易系统 【副图】
• Confluence Trading System. 共振交易系统 【主图】
• Pivot Trading System. 高低点捕捉交易系统 【主图】
• Momentum Dynamic Trading System. 动能交易系统 【主图】
• Alpha Quantitative Trading System. 量化交易系统 【主图】
• Cycle Trading System. 周期转折交易系统 【主图】
• Reversal Trading System. 反转捕捉交易系统 【副图】
部分标的自入选以来已录得超过 +400% 回报。
Subscribing members also receive full access to:
• Trading opportunity reports
• Deep research reports
• Potential watchlist
• Core watchlist
• Full access to all 18 professional trading systems:
• QuantFlow Trading System [Main Chart]
• Trail Trading System [Main Chart]
• Dot Trading System [Sub Chart]
• Apex Pro Trading System [Main Chart]
• Apex Trading System [Main Chart]
• Rainbow Trading System [Sub Chart]
• Force Trading System [Sub Chart]
• Radar Trading System [Sub Chart]
• Flow Trading System [Sub Chart]
• Duel Trading System [Sub Chart]
• Zone Trading System [Sub Chart]
• Sigma Trading System [Sub Chart]
• Confluence Trading System [Main Chart]
• Pivot Trading System [Main Chart]
• Momentum Dynamic Trading System [Main Chart]
• Alpha Quantitative Trading System [Main Chart]
• Cycle Trading System [Main Chart]
• Reversal Trading System [Sub Chart]
Some selections have returned over +400% since inclusion.
🎁 早鸟限时优惠 · Early Bird Special
市场上单一指标订阅价格约 $98–$168/月。
财富俱乐部为你提供:
- 18套专业交易系统完整使用权
- 深度研究报告
- 交易机会报告
- 核心名单完整访问权限
每月只需 $39,每天不到 $1.30。优惠期完结恢复每月 $68。
A single indicator subscription on the market costs $98–$168/month.
Wealth Club gives you:
- Full access to 18 professional trading systems
- Deep research reports
- Trading opportunity reports
- Complete core watchlist access
All for just $39/month — less than $1.30 per day. Regular price of $68/month applies after the early bird period ends.
Subscribe now and lock in your early bird rate.
Force · 多空动能交易系统 · 完整使用指南
绿线刚转色,但你知道该在哪一刻入场吗?填充区域开始收窄,你知道该在哪里止赚离场吗?价格跌破支撑,你知道止损该设在哪里吗?Force 与主图系统同时共振的时候,你知道那是胜率最高的时机吗?
每一个问题,都是散户长期追涨杀跌、乱做交易的根源。完整使用指南在下方——让你从今天开始,用系统代替感觉,用纪律代替冲动,每一笔交易都有据可依。
Force · Force Trading System · Complete Usage Guide
The green line just changed color — but do you know the exact moment to enter? The fill zone starts to narrow — do you know where to take profit and exit? Price breaks support — do you know where your stop-loss should be? When Force resonates with the main-chart system simultaneously, do you know that's the highest-probability window to act?
Every one of these questions is the root cause of why retail traders keep chasing rallies and panic-selling. The complete usage guide is below — so from today, you trade with a system instead of instinct, with discipline instead of impulse, with a clear reason behind every single trade.