共振交易系统 · Confluence Trading System

【主图 · Main Chart】
一个信号可以是巧合。两个维度同时确认,就不是了。
One signal can be a coincidence. Two dimensions confirming simultaneously — that's not.
在交易里,最危险的事不是错过机会,而是在错误的信号上重仓进场。单一指标永远有盲点,单一周期永远有噪音。真正高胜率的交易,来自于多个维度同时指向同一个方向的那一刻。Confluence Trading System · 共振交易系统由财富俱乐部量化分析团队打造,专门捕捉这种多维度共振的关键时刻——把最高确信度的市场结构,直接呈现在你的图表上。
In trading, the most dangerous thing is not missing an opportunity — it's entering heavily on a wrong signal. A single indicator always has blind spots. A single timeframe always has noise. Truly high-probability trades come from the moment when multiple dimensions simultaneously point in the same direction. The Confluence Trading System · 共振交易系统, built by the Wealth Club quantitative analysis team, is designed to capture exactly these moments — presenting the highest-confidence market structure directly on your chart.
无需成为图表专家,强大的算法自动为你绘制所有关键信息。适用于股票、加密货币、外汇和商品等任何金融市场,支持1m、5m、15m、1h、4H、1D等所有主流时间框架。无论你是日内交易者、波段交易者还是趋势交易者,Confluence都能为你清晰呈现市场的结构状态,让你像机构一样进行交易。
No need to be a chart expert. Our powerful algorithm automatically plots all key information for you. Compatible with any financial market — stocks, crypto, forex, and commodities — across all major timeframes including 1m, 5m, 15m, 1h, 4H, and 1D. Whether you're a day trader, swing trader, or trend trader, Confluence gives you a clear picture of the market's structural state so you can trade like an institution.
这套系统做了什么?
What does this system do?
财富俱乐部量化分析团队通过以下四个维度构建这套系统:
深度量化研究公司财务数据
K线与趋势技术指标分析
机构主力资金流向监测
大数据与AI驱动的多因子模型
The Wealth Club quantitative analysis team built this system across four dimensions:
In-depth quantitative research of company financial data
Candlestick and trend technical indicator analysis
Institutional capital flow monitoring
Big data and AI-driven multi-factor model
在上述四个维度的基础上,Confluence系统额外整合了多时间框架共振度评分(Multi-Timeframe Confluence Score)与信号强度分级模型(Signal Conviction Grading)。前者是机构量化策略中用于过滤低质量信号的核心方法,通过日线、周线、月线多周期数据的叠加验证,只有当多个周期同时形成共振时,系统才输出信号;后者则将每一个信号按共振强度自动分为强、中、弱三个等级,帮助你根据信号质量精准调整仓位大小。
In addition to the four core dimensions, the Confluence system further integrates a Multi-Timeframe Confluence Score and a Signal Conviction Grading Model. The former is a core method used in institutional quantitative strategies to filter low-quality signals — signals are only generated when daily, weekly, and monthly timeframes simultaneously confirm resonance. The latter automatically grades every signal into three conviction levels — strong, moderate, and weak — enabling precise position sizing based on signal quality.
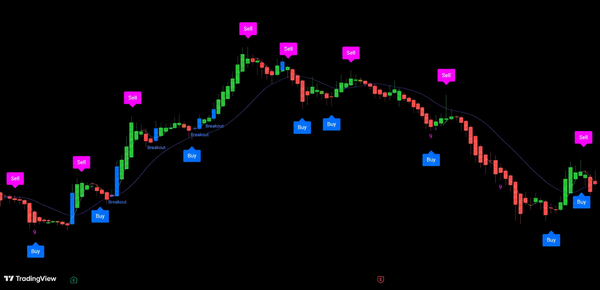
Confluence在图表上同时运行两套量化通道系统,各自独立追踪不同维度的市场数据。
第一套量化通道(小周期通道)直接告诉你现在处于什么趋势环境。通道转为绿色,代表当前处于上升通道,趋势向上;通道转为红色,代表当前处于下降通道,趋势向下。你不需要判断,颜色已经告诉你答案。
The first quantitative channel system (short-cycle channel) directly tells you what trend environment you’re currently in. When the channel turns green, you’re in an uptrend; when it turns red, you’re in a downtrend. You don’t need to interpret—the color gives you the answer.
第二套量化通道(大周期通道)实时追踪另一个维度的市场方向。当两套量化通道同时指向同一个方向,多维度共振成立,这就是市场结构最清晰、操作确信度最高的时刻。
The second quantitative channel system (large-cycle channel) tracks market direction across another timeframe dimension in real-time. When both channel systems point in the same direction simultaneously, multi-dimensional confluence is confirmed—this is when market structure is clearest and conviction is highest.
最终呈现在你面前的,只有一件事:两套通道的颜色。
What's presented to you is simple: the color of the two channels.
🟢 绿色通道 → 上升趋势,多头结构
🟢 Green channel → Uptrend, bullish structure
🔴 红色通道 → 下降趋势,空头结构
🔴 Red channel → Downtrend, bearish structure
订阅后即可解锁Confluence完整使用指南,包括:
Subscribe to unlock the complete Confluence usage guide, including:
如何判断两套量化通道共振的强弱程度,什么级别值得重仓进场,什么级别只适合轻仓试探
How to judge the strength of two-channel resonance — what level warrants a full position and what level only warrants a light test position
哪个时间周期效果最好,日线、周线、小时线各有什么不同用法
Which timeframe works best — how daily, weekly, and hourly charts each serve a different purpose
通道颜色转变时的具体操作——绿色通道出现时应该如何布局,红色通道出现时应该如何应对
Exactly what to do when the channel color changes — how to position when the green channel appears and how to respond when the red channel appears
如何配合支撑位、压力位及副图系统使用,形成更高胜率的交易系统
How to combine with support and resistance levels and sub-chart systems to build a higher win-rate trading system
如何在TradingView上获得这个指标的专属授权,直接在你自己的账户上实时使用
How to obtain exclusive TradingView access to run this indicator live in your own account
25 套量化交易信号系统 · 完整交易生态系统
25 Quantitative Trading Signal Systems · A Complete Trading Ecosystem
我们提供的,从来不只是一套买卖信号工具。
What we offer has never been just a set of buy and sell signals.
Wealth Club 构建的是一个完整的交易生态系统——25 套量化买卖信号交易系统、深度研究报告、交易机会报告、核心持仓名单、高潜力名单、市场简报、市场前瞻与投资学堂,七大模块有机结合,覆盖从宏观研判到精准入场的完整交易闭环。
Wealth Club is built around a complete trading ecosystem — 25 quantitative signal trading systems, deep research reports, trading opportunity reports, core watchlist, high-potential watchlist, market briefs, market outlook, and investment academy. Seven integrated modules covering everything from macro analysis to precise entry execution — a complete trading loop.
订阅会员可获得完整访问权限,包括:
Subscribing members receive full access to:
交易机会报告
深度研究报告
潜力名单
核心名单
25 套专业交易系统完整使用权
Trading opportunity reports
Deep research reports
Potential watchlist
Core watchlist
Full access to all 25 professional trading systems
主图系统 Main Chart Systems
QuantFlow Trading System · 量化趋势交易系统 【主图】【Main Chart】
Apex Pro Trading System · 巅峰交易系统 【主图】【Main Chart】
Apex Trading System · 顶点交易系统 【主图】【Main Chart】
Confluence Trading System · 共振交易系统 【主图】【Main Chart】
Confluence Pro Trading System · 共振进阶交易系统 【主图】【Main Chart】
Pivot Trading System · 高低点捕捉交易系统 【主图】【Main Chart】
Momentum Dynamic Trading System · 动能交易系统 【主图】【Main Chart】
Alpha Quantitative Trading System · Alpha量化交易系统 【主图】【Main Chart】
Cycle Trading System · 周期转折交易系统 【主图】【Main Chart】
Reversal Pro Trading System · 反转捕捉进阶交易系统 【主图】【Main Chart】
Top & Bottom Trading System · 逃顶抄底交易系统 【主图】【Main Chart】
Auto Support & Resistance Trading System · 智能支撑压力交易系统 【主图】【Main Chart】
副图系统 Sub Chart Systems
Trail Trading System · 轨迹信号交易系统 【副图】【Sub Chart】
Dot Trading System · 点位信号交易系统 【副图】【Sub Chart】
Rainbow Trading System · 彩虹趋势交易系统 【副图】【Sub Chart】
Force Trading System · 多空动能交易系统 【副图】【Sub Chart】
Radar Trading System · 雷达交易系统 【副图】【Sub Chart】
Flow Trading System · 顺势交易系统 【副图】【Sub Chart】
Duel Trading System · 多空对决交易系统 【副图】【Sub Chart】
Zone Trading System · 热度预警交易系统 【副图】【Sub Chart】
Sigma Trading System · 顶底捕捉交易系统 【副图】【Sub Chart】
Reversal Trading System · 反转捕捉交易系统 【副图】【Sub Chart】
Top & Bottom Hunter Trading System · 顶底猎手交易系统 【副图】【Sub Chart】
Smart Money Hunter Trading System · 主力猎手交易系统 【副图】【Sub Chart】
部分标的自入选以来已录得超过+700%回报。
Some selections have returned over +700% since inclusion.
我们的价格
Our Pricing
月费:$68每月
Monthly plan: $68/month
年费:$38每月 · $456每年(较月费节省44%)
Annual plan: $38/month · $456/year (save 44% versus monthly)
以年费计算,每天实际成本仅$1.25。平均每套系统每天不到5美分。
On the annual plan, your actual daily cost is just $1.25. That works out to less than 5 cents per system per day.
为什么选择 Wealth Club?
Why Wealth Club?
以下数据来自市场同类产品的公开定价,对比之下,Wealth Club 的会员方案是市面上性价比最高的选择之一。
The following figures are based on publicly available pricing for comparable market products. By comparison, Wealth Club membership represents one of the best-value propositions available today.
市场上,一套专业交易指标的订阅费用通常约为$98至$168美元每月。而Wealth Club为你提供的,不只是25套不同功能的专业交易系统,更是一个覆盖从宏观研判到精准入场的完整交易生态系统。
A single professional trading indicator typically costs between $98 and $168 per month on the open market. What Wealth Club offers is not just 25 professional trading systems with different functions — it is a complete trading ecosystem covering everything from macro analysis to precise entry execution.
市场价值对比
Market Value Comparison
25套量化交易信号系统 × 市场均价$98至$168每月 = $2,450至$4,200每月
25 quantitative trading systems × market rate $98–$168/month = $2,450–$4,200/month
研究报告与交易机会报告 ≈ $500每月
Research reports and trading opportunity reports ≈ $500/month
市场总价值 ≈ $2,950至$4,700每月
Total market value ≈ $2,950–$4,700/month
现在就是时候 | The Time Is Now
大多数人等待”完美时机”入场——但完美时机永远不会来。真正的机会,从来只属于提前布局的人。市场不等人。现在加入的人,看到的永远比后来者多一步。
Most people wait for the “perfect moment” to act — but that moment never arrives. Real opportunity has always belonged to those who position ahead of it. The market does not wait. Those who act now will always be one step ahead.
🎁 早鸟限时优惠 · 月费:$68每月 — 优惠期结束后恢复原价每月$88。
🎁 早鸟限时优惠 · 年费:$38每月 · $456每年 — 优惠期结束后恢复原价每月$58 · $696每年。
🎁 Early Bird Special · Monthly plan: $68/month — Price will return to $88/month after the promotional period ends.
🎁 Early Bird Special · Annual plan: $38/month · $456/year — Price will return to $58/month · $696/year after the promotional period ends.
Subscribe now and lock in your early bird rate.
你获得的,是市价$2,950至$4,700每月的完整交易生态系统。你支付的,是$456每年。这还不包括我们的会员已在交易机会名单上录得+100%至+700%回报的实际价值。所有操作记录均已公开于会员平台,供会员随时核对对照。
What you receive is a complete trading ecosystem worth $2,950 to $4,700 per month on the open market. What you pay is $456 per year. And that figure does not even account for the +100% to +700% returns our members have already achieved from the Trading Ideas watchlist. All trade records are published openly on the member platform, available for members to verify and cross-reference at any time.
这不只是一个订阅,而是一个持续成长的平台。团队将持续因应市场变化、科技发展及交易研究的最新成果,不断添加更多增值内容。与此同时,现有的交易系统将持续整合AI与机器学习技术,不断强化信号精准度与市场适应能力。团队也会持续研发全新的交易系统,所有新系统上线后,现有会员均可同步免费使用。
This is not simply a subscription — it is a platform that grows with you. The team will continuously add new value-added content in response to market developments, technological advancements, and the latest research. At the same time, existing trading systems will be continuously enhanced through the integration of AI and machine learning, improving signal precision and adaptability across different market conditions. The team is also actively developing new trading systems — and as each one launches, all existing members will have free access automatically.
我们已经见证了许多会员从零开始,逐步摸索出一套真正适合自己的交易战法,并在市场中取得了属于自己的成果。不少会员在我们的核心名单与交易机会标的上取得了+100%至+700%以上的成绩。希望接下来,我们能见证更多会员的成长故事。
We have already seen many members start from scratch, gradually develop a trading approach that truly suits them, and achieve results of their own in the market. A number of members have achieved gains of +100% to +700% and beyond on positions from our Core Watchlist and Trading Ideas. We look forward to witnessing many more member success stories in the chapters ahead.
每一位今天加入的会员,都将是这一切成长的受益者。市场不等人,系统越早用越熟,优势越早建立。你开始的那一天,就是你与其他散户拉开距离的那一天。
Every member who joins today will be among the first to benefit from everything that comes next. The market does not wait. The earlier you build your system, the earlier you build your edge. The day you start is the day you begin pulling ahead.

掌握这套系统的关键,不只是知道通道颜色代表什么——而是知道在不同情况下,该如何行动。
The key to mastering this system is not just knowing what the channel colors mean — it is knowing exactly how to act in each situation.
当红绿MFI动能通道(小周期通道)刚由红转绿,但蓝色/红色SRB基准线(大周期通道)仍然呈粉红色向下运行,你知道这只是下跌中的一次短暂反弹,还是趋势真正开始修复了吗?当红绿MFI动能通道(小周期通道)与蓝色/红色SRB基准线(大周期通道)同时转向,两者颜色完全一致,代表的力度和只有一条转向完全不同——你知道如何区分这两种情况吗?当红绿MFI动能通道(小周期通道)与蓝色/红色SRB基准线(大周期通道)方向出现分歧,市场进入震荡,你知道应该观望还是轻仓布局吗?每一个问题,都是散户长期追涨杀跌、乱做交易的根源。完整使用指南在下方——让你从今天开始,用系统代替感觉,用纪律代替冲动,每一笔交易都有据可依。
When MFI Momentum Channel (short-cycle channel) just turns from red to green, but SRB Baseline (large-cycle channel) remains pink and pointing downward, do you know if this is just a temporary bounce within a downtrend, or if the trend is truly beginning to recover? When MFI Momentum Channel (short-cycle channel) and SRB Baseline (large-cycle channel) turn simultaneously with colors in perfect alignment, the force is entirely different from only one turning—do you know how to distinguish between these two scenarios? When MFI Momentum Channel (short-cycle channel) and SRB Baseline (large-cycle channel) diverge in direction and the market enters consolidation, do you know whether to stand aside or micro-position? Every single one of these questions is the root cause of retail traders' perpetual chasing rallies, selling dips, and chaotic trading. The complete usage guide below—starting today, replace intuition with systems, replace impulse with discipline, and back every trade with evidence.
以下是Confluence共振交易系统的完整使用指南,包括两套通道解读、共振强弱判断、入场时机、止损纪律、离场时机,以及如何与其他系统配合使用。
The following is the complete usage guide for the Confluence Trading System — covering two-channel interpretation, resonance strength assessment, entry timing, stop-loss discipline, exit timing, and how to combine it with other systems for maximum effectiveness.
一、读懂两套通道的含义
Understanding the Two Channels
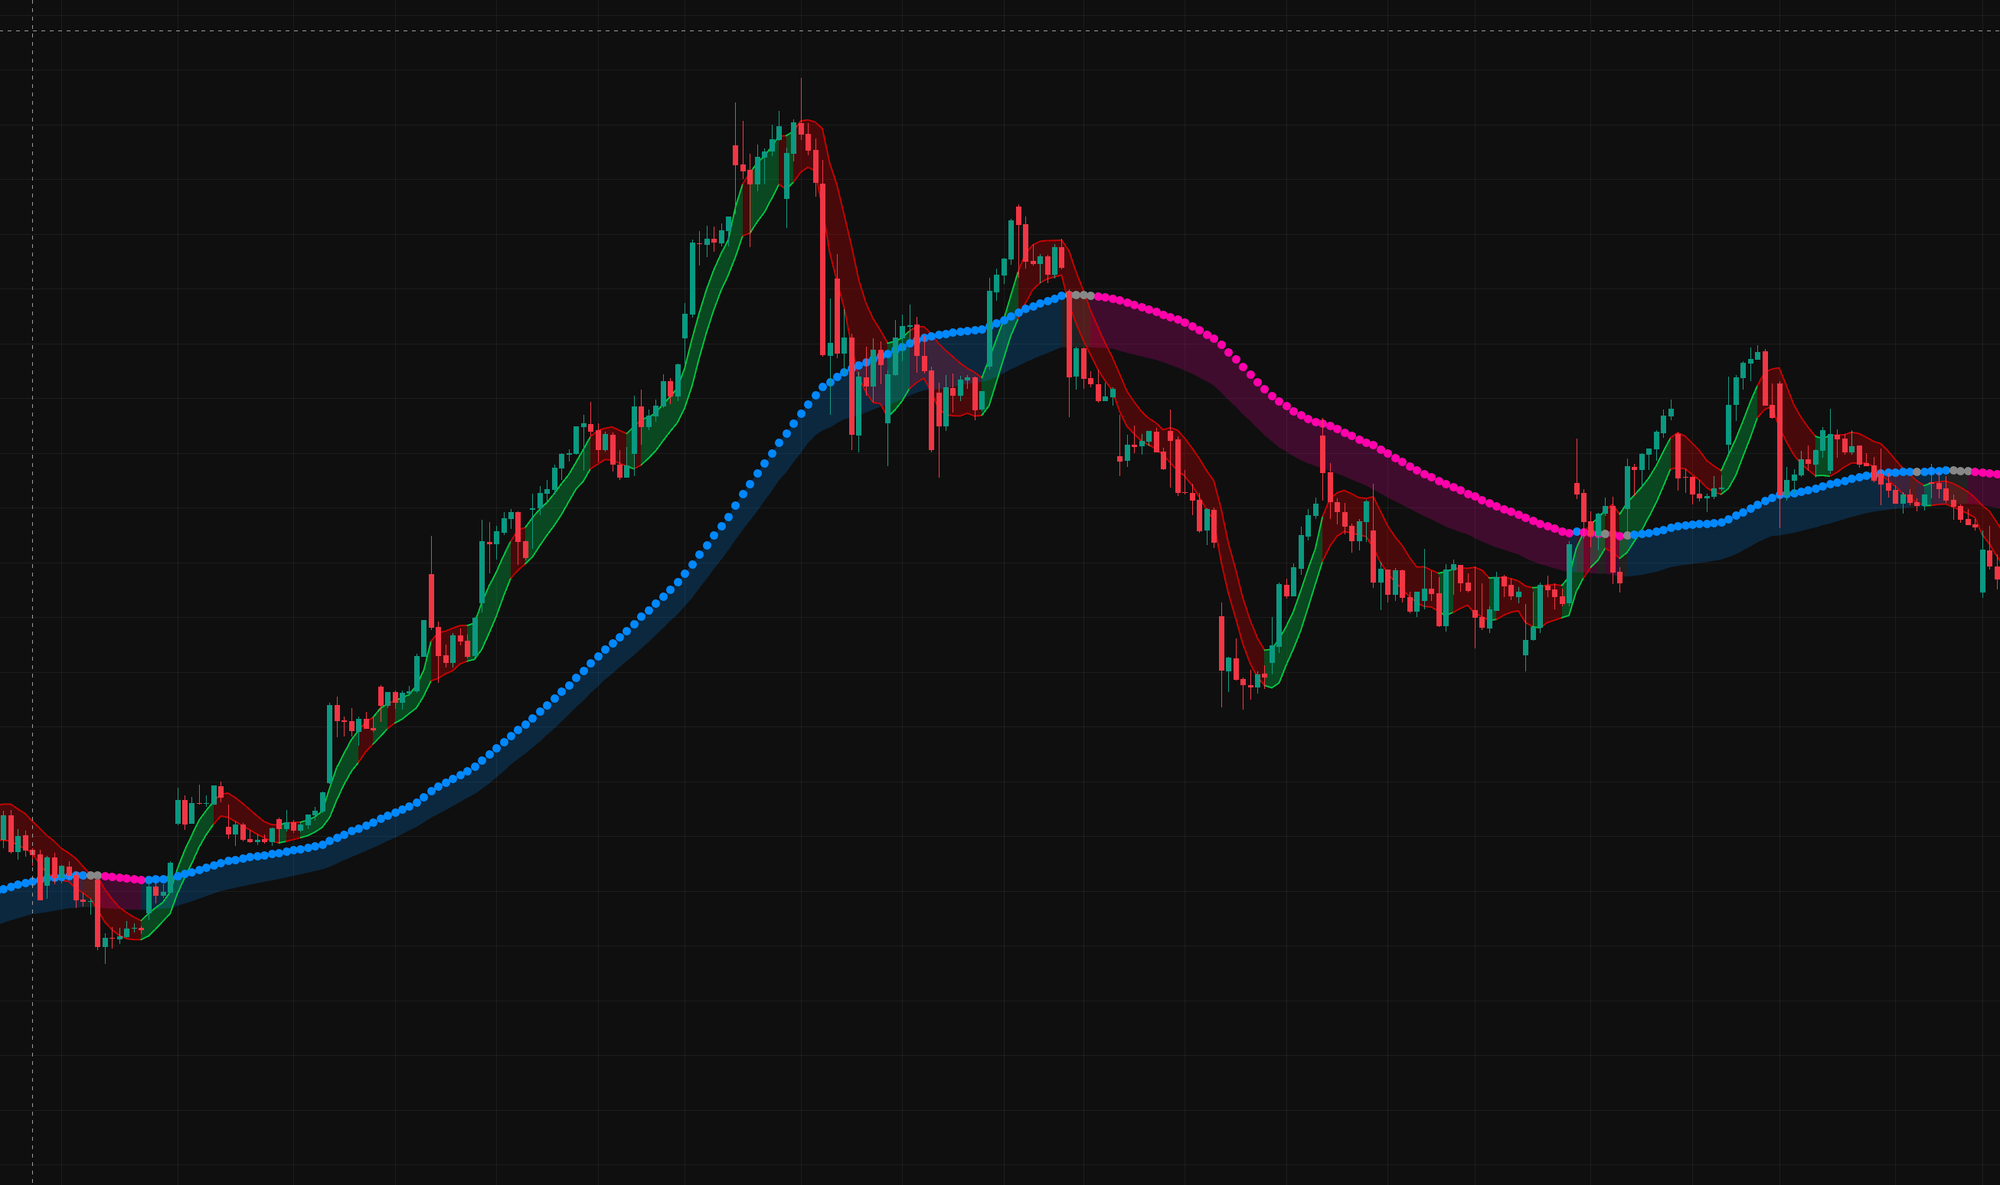
Confluence在主图上同时运行两套独立的量化通道,两套通道各自追踪不同时间维度的市场结构,相互独立又相互验证。
红绿MFI动能通道(小周期通道)追踪短期价格动能,对价格变化高度敏感,率先反映趋势方向的切换。通道填充绿色代表短期趋势向上;填充红色代表短期趋势向下。
蓝色/红色SRB基准线(大周期通道)追踪中长期趋势结构,整合了机构级别的资金流向数据与多周期趋势共振评分。走势平稳,只在市场结构发生实质性改变时才改变方向。通道填充蓝色代表中长期趋势持续向上;填充深红色代表中长期趋势持续向下。
MFI Momentum Channel (short-cycle channel) tracks short-term price momentum, is highly sensitive to price changes, and is the first to reflect trend direction reversals. Channel fill in green represents uptrend in the short term; channel fill in red represents downtrend in the short term.
SRB Baseline (large-cycle channel) tracks medium-to-long-term trend structure, integrating institutional-level capital flow data and multi-cycle trend confluence scoring. Price action is smooth and only changes direction when market structure undergoes material shifts. Channel fill in blue represents sustained uptrend in the medium-to-long term; channel fill in deep red represents sustained downtrend in the medium-to-long term.
二、四个入场时机
Four Entry Opportunities
Confluence的核心操作逻辑是:价格与两套通道的关系,决定了你应该在哪里入场、入多少仓位。
The core operating logic of Confluence is: the relationship between price and the two channels determines where you should enter and how much to position.
第一入场点:红绿小周期通道由红色转为绿色(最早机会)
当红绿小周期通道仍处于蓝色/红色大周期通道下方时,小周期通道由红色转为绿色,蜡烛图站上绿色通道,可视为最早的入场机会,胜率约四成。
这是四个入场点中最早的买入机会。代表短期动能开始转变。此时价格处于相对低位,入场成本最优,但趋势尚未完全确认,存在回调的可能性,胜率约四成。建议以极小仓位试仓入场。
First Entry Point: Short-Cycle Channel Transitions from Red to Green (Earliest Opportunity)
This is the earliest buying opportunity among the four entry points. It represents the beginning of short-term momentum shift. At this stage, price is at a relatively low level with optimal entry cost, but the trend is not yet fully confirmed and there remains the possibility of pullbacks, with a win rate of approximately 40%. It is recommended to enter with an extremely small test position.
第二入场点:红绿MFI动能通道同时穿越蓝色/红色SRB基准线站稳其上方(胜率超八成)
当红绿MFI动能通道(小周期通道)从下方穿越蓝色/红色SRB基准线(大周期通道),蜡烛图站稳通道上方,代表短期和中长期趋势完全共振,这是整套系统信号质量最高的入场时机,胜率超过八成。此时也是第二批仓位的加仓点,建议补入剩余计划仓位的主要部分。
Second Entry Point: MFI Momentum Channel (Short-Cycle Channel) Breaks Through and Holds Above SRB Baseline (Large-Cycle Channel) (Win Rate Over 80%)
When the MFI Momentum Channel (short-cycle channel) breaks through from below the SRB Baseline (large-cycle channel) and the candlestick holds firmly above the channel, it represents complete confluence between short-term and medium-to-long-term trends. This is the highest-quality entry signal from the entire system with win rate exceeding 80%. This is also the scaling-in point for the second batch of positions. It is recommended to add the main portion of remaining planned position size.
第三入场点:红绿MFI动能通道(小周期通道)升穿蓝色/红色SRB基准线(大周期通道)拉升后回调撞上SRB基准线(大周期通道)发生反弹站稳(趋势中继加仓)
Third Entry Point: MFI Momentum Channel (Short-Cycle Channel) Breaks Above SRB Baseline (Large-Cycle Channel), Rallies, Pulls Back to Touch SRB Baseline (Large-Cycle Channel), and Bounces to Hold (Trend Continuation Scaling)
第四入场点(新一轮买入机会)
当小周期通道跌穿大周期通道后重新升穿大周期通道上方,可视为新一轮买入机会,重新建立仓位。
Fourth Entry Point (New Round of Buying Opportunity)
When the Short-Cycle Channel breaks below the Large-Cycle Channel and then rises back above it, this can be regarded as a new round of buying opportunity to re-establish positions.
三、离场策略
Exit Strategy
离场分为三个阶段,越早执行,锁住的利润往往越多。
The exit strategy has three defined phases. The earlier you act, the more profit you typically secure.
第一离场点(最早预警信号):红绿MFI动能通道由绿色转为红色
这是三个离场点中最早的预警信号。当红绿MFI动能通道由绿色转为红代表短期动能可能转变变弱可以沽出一部份仓位。多系统共振信号明显优于单一主图信号。确认关键支持位被跌穿此时可以开始分批减仓,在相对高位提前锁住部分利润。越早在高位减仓,最终落袋的利润往往越多。但需留意主力是否有震仓或假跌破的现象。
First Exit Point (Earliest Warning Signal): MFI Momentum Channel (Short-Cycle Channel) Turns from Green to Red
This is the earliest warning signal among the three exit points. When the MFI Momentum Channel (Short-Cycle Channel) transitions from green to red, it indicates a potential weakening in short-term momentum, signaling the opportunity to sell a portion of the position. Multi-system confluence signals are significantly more reliable than single main chart signals. Once key support levels are confirmed to be broken, you can begin to reduce positions in batches, locking in partial profits at relatively high levels. The earlier you reduce positions at higher prices, the more profits you typically capture in the end. However, pay close attention to whether institutional players are shaking out weak hands or creating false breakdowns.
第二离场点:蜡烛图跌穿红绿MFI动能通道下边缘(小周期通道)(建议大幅减仓清仓)
当蜡烛图跌穿红绿MFI动能通道下边缘(小周期通道),这是第二个明确的离场信号,建议在此位置减仓大部分仓位,甚至考虑全部清仓。若此时利润丰厚,不想全部清仓,可保留一至两成仓位继续观察,等待价格在蓝色/红色SRB基准线(大周期通道)附近出现反弹再重新评估。
Second Exit Point: Candlestick Breaks Below MFI Momentum Channel (Short-Cycle Channel) Lower Edge (Recommend Significant Position Reduction or Complete Exit)
When candlestick breaks below MFI Momentum Channel lower edge (short-cycle channel), this is the second clear exit signal. It is recommended to reduce most positions at this level, or even consider complete exit. If profits are substantial at this point and you prefer not to exit completely, you may retain 10-20% of your position to continue observing, waiting for price to bounce near SRB Baseline (large-cycle channel) before reassessing.
第三离场点(底线):红绿MFI动能通道(小周期通道)跌穿蓝色/红色SRB基准线(大周期通道)(必须全部清仓)
当红绿MFI动能通道(小周期通道)进一步跌穿蓝色/红色SRB基准线(大周期通道),代表中长期趋势已经发生实质性改变。无论此前是否已经减仓,剩余所有仓位必须在此全部清仓,没有例外。
Third Exit Point (Bottom Line): MFI Momentum Channel (Short-Cycle Channel) Breaks Below SRB Baseline (Large-Cycle Channel) (Must Exit All Positions)
When MFI Momentum Channel (short-cycle channel) further breaks below SRB Baseline (large-cycle channel), it signals the medium-to-long-term trend has undergone material change. Regardless of whether positions have been partially reduced previously, all remaining positions must be completely exited at this level without exception.
四、止损纪律
Stop-Loss Discipline
入场之后,止损是整套操作中最不能省略的一步。但止损的执行方式,因交易风格不同而完全不同。在行动之前,你必须先清楚自己属于哪一种交易者。
当价格跌破关键支撑位,都应该立即减仓离场,等待下一个入场机会重新入场。不要抱侥幸心理等待反弹——趋势一旦破位,等待的代价往往比减仓的损失大得多。
After entry, stop-loss is the most essential step that cannot be omitted in the entire trading operation. However, the execution method of stop-loss varies completely depending on different trading styles. Before taking action, you must first understand which type of trader you are.
When price breaks below key support levels, you should immediately reduce positions and exit, waiting for the next entry opportunity. Do not hold onto hope waiting for a bounce—once a trend breaks its support, the cost of waiting is often far greater than the loss of reducing positions.
严格仓位管理为什么长期一定赚钱
Why Strict Stop-Losses Win in the Long Run
很多人不愿意在价格下跌时减仓,觉得减仓就是认输。但真正的交易数学告诉你完全相反的结论。假设你每次在支撑位下方适量减仓,控制每次的回撤幅度。就算你连续判断错误数次,每次控制在小幅减仓,总体回撤依然可控。但只要你有数次在低位建仓之后价格直接上升,利润可能达到数倍于减仓幅度。长期下来,你不需要每次都做对——只需要做对的时候拿住趋势,做错的时候灵活减仓,总账户一定是正的。
Many traders are reluctant to reduce positions when price falls, seeing it as giving up. But the actual mathematics of trading tells you the exact opposite. Assume you reduce your position by a modest amount below each support level, keeping each individual drawdown controlled. Even if you are wrong several times in a row, each with a small reduction, the overall drawdown remains manageable. But if just a few of those entries are followed by a strong upward move, the gains can be many times the size of any individual reduction. Over time, you do not need to be right every time — you simply need to hold winners when the trend runs and reduce flexibly when conditions shift. The math will take care of the rest.
这就是专业交易者与散户最根本的区别——不是谁看得更准,而是谁在不利情况下损失更小。
This is the most fundamental difference between professional traders and retail investors — not who is more often right, but who loses less when conditions turn unfavourable.
⚠️ 入场,出场时的重要提醒 - 双通道系统版本
⚠️ Important Reminders When Entering and Exiting Positions - Dual-Channel System Version
⚠️ 关于通道运行时的信号有效性
① 若蜡烛图与绿色通道并排向上运行,卖出信号无效 If candles move up alongside the green channel, sell signals are invalid
② 若蜡烛图与红色通道并排向下运行,买入信号无效 If candles move down alongside the red channel, buy signals are invalid
⚠️ 周期通道变色的权重大于标签信号(适用于双通道系统)
① 周期通道变色的权重大于标签买入卖出的提示讯号。若标签买入讯号出现早于通道变绿色,建议等待通道变绿色再操作。
② 同样,若标签卖出讯号出现早于通道变红色,建议等待通道变红色再操作。
⚠️ Note①: The weight of channel color change carries more significance than the Buy/Sell label signal prompts. If the Buy label signal appears before the channel turns green, it is recommended to wait for the channel to turn green before taking action.
⚠️ Note②: Similarly, if the Sell label signal appears before the channel turns red, it is recommended to wait for the channel to turn red before taking action.
⚠️ 窄幅震荡中的频繁切换陷阱
① 如果蜡烛图和通道平衡窄幅上下震动,颜色短暂频繁的震荡切换,买入及卖出信号无效。建议结合其他交易指标共振或等待下一步明显的趋势再行操作。
② 当蜡烛图与通道平衡运行、在震荡区间内波动时,不适宜进行判断交易,请耐心等待确认出现明确方向后再交易。
⚠️ Note①: If the candle and channel oscillate narrowly within a balanced range with frequent color switching, both Buy and Sell signal prompts are invalid. It is recommended to combine with other trading indicators resonating together or wait for the next clear trend before taking action.
⚠️ Note②: When candles move in balance with the channel, oscillating within a range, judgment-based trading is not suitable — wait patiently for a confirmed clear directional break before trading.
⚠️ 下降通道中的买入风险
① 若在明显的红色下降通道中出现绿色,注意可能只是局部反弹信号,并非趋势真正逆转的确认。当红绿MFI动能通道(小周期通道)仍处于蓝色/红色SRB基准线(大周期通道)下方,代表整体趋势仍处于下降阶段。
② 红绿MFI动能通道(小周期通道)转绿可能只是局部反弹信号,并非趋势真正逆转的确认。在这种情况下操作,胜率偏低,但成本较低,价格有优势,需格外谨慎。建议结合其他交易指标发生共振确认是底部反转来增加胜率。
仓位必须极小,做好随时减仓的准备
Keep position size very small and be fully prepared to reduce at any time
一旦信号失效,立即止损离场,不犹豫、不等待
If the signal fails, exit immediately without hesitation or delay
所有在蓝色/红色SRB基准线(大周期通道)下方出现的入场机会,都必须以谨慎态度对待。
All entry opportunities that appear below the SRB Baseline (large-cycle channel) must be treated with caution.
⚠️ Critical Reminder①: If green appears within a clearly downtrending red channel, note this may be only a local bounce, not a true trend reversal. When the MFI Momentum Channel (short-cycle channel) remains below the SRB Baseline (large-cycle channel), it signals that the overall trend is still in a declining phase.
⚠️ Critical Reminder②: The MFI Momentum Channel (short-cycle channel) turning green may represent only a localized bounce signal rather than confirmation of a genuine trend reversal. Trading under these conditions carries a lower win rate, though cost is lower and price offers an advantage — extra caution is required. It is recommended to await confirmation from other trading indicators resonating simultaneously to confirm a bottom reversal and increase win rate.
⚠️ 买入后的止损管理(适用于双通道系统)
① 如果红绿MFI动能通道(小周期通道)仍处于蓝色/红色SRB基准线(大周期通道)下方时提前买入,之后蜡烛图跌穿红绿MFI动能通道(小周期通道)且通道变成红色。
② 需要立即减仓离场再做下一步观察。
⚠️ Note①: If you entered early when the MFI Momentum Channel (short-cycle channel) was still below the SRB Baseline (large-cycle channel), and afterwards the candle breaks below the MFI Momentum Channel (short-cycle channel) and the channel turns red.
⚠️ Note②: You must immediately reduce position and exit, then observe for the next action.
⚠️ 择股策略:先看大盘,再选个股
① 先看大盘再看个股。大盘在上升通道时胜率高,大盘在下降通道时胜率低。
② 建议交易上升通道的股票,避免交易下降通道的股票,因为上升通道胜率高,下降通道胜率低(左侧建仓情况的价值投资例外)
⚠️ Note①: Check the broader market first before individual stocks. Win rate is higher when the overall market is in an uptrend, and lower when in a downtrend.
⚠️ Note②: It is recommended to trade stocks in rising channels and avoid trading stocks in falling channels, as rising channels have higher win rates while falling channels have lower win rates (with the exception of value investing scenarios involving left-side position building).
⚠️ 窄幅震荡中的假突破识别与多维度确认
① 在窄幅震荡环境下,通道线会频繁在绿色和粉红色SRB基准线之间翻动。这个时候单独看转绿色讯号很容易踩进假突破的陷阱——转绿之后价格可能继续在窄幅范围内波动,随后又转回粉红色。这是正常的市场行为,不是指标故障。
② 最成熟的做法是:不单独依赖转绿色讯号,而是同时确认: • 价格是否处于Auto Support & Resistance Trading System标注的关键支撑位附近 • Zone热度预警交易系统是否显示超卖状态 • Smart Money Hunter主力猎手交易系统是否显示主力资金流入
只有多个维度同时确认,才能有效区分真正的修复机会与窄幅震荡中的假突破。
⚠️ Key Reminder①: In consolidation environments with narrow-range oscillation, the channel line may flip frequently between green and pink SRB Baseline. Relying solely on a turn-to-green signal here can easily lead to false breakout traps — after turning green, price may continue to oscillate within the narrow range before turning pink again. This is normal market behavior, not an indicator malfunction.
⚠️ Key Reminder②: The mature approach is to not rely solely on the green turn, but to simultaneously confirm: • Whether price is near a key support level marked by Auto Support & Resistance Trading System • Whether Zone Trading System shows an oversold condition • Whether Smart Money Hunter Trading System indicates institutional money inflow
Only when multiple dimensions confirm together can you effectively distinguish true repair opportunities from false breakouts within narrow-range consolidation.
五、避免假信号
Avoiding False Signals
当蓝色/红色SRB基准线(大周期通道)横盘或窄幅震荡的时候,红绿MFI动能通道(小周期通道)会频繁在红绿之间切换,但每次颜色变化后的价格移动幅度很小。这是市场缺乏方向性动能的典型表现。遇到这种情况,建议以观望为主,配合其它交易指标发生共振趋势方向再操作增加胜率。
When SRB Baseline (large-cycle channel) (during consolidation or narrow-range oscillation), MFI Momentum Channel (short-cycle channel) will frequently switch between red and green, but each price movement after color change is small. This is a typical manifestation of market lacking directional momentum. When encountering this situation, it is recommended to remain on the sidelines and combine with other trading indicators for confluence in trend direction before operating to increase win rate.
六、多指标共振,胜率才是最大
Multi-Indicator Resonance Maximizes Win Rate
没有任何一套交易系统能够做到100%准确,Confluence也不例外。真正能够大幅提升胜率的方法,是等待多个系统同时指向同一个方向——这就是共振。
No trading system is 100% accurate — Confluence is no exception. The method that genuinely and significantly improves your win rate is waiting for multiple systems to simultaneously point in the same direction. This is resonance.
七、与其他系统配合使用 - 多系统共振,胜率才是最大
Combining with Other Systems, Multi-System Resonance Maximizes Win Rate
Confluence作为主图系统,最适合配合Auto Support & Resistance Trading System · 智能支撑压力交易系统的支撑位与压力位,以及副图的Sigma · 顶底捕捉交易系统或Zone · 热度预警交易系统同时使用。当价格处于关键支撑位附近,同时副图系统也同步确认多头方向,整套系统的置信度达到最高水平,是最值得重仓执行的入场机会。
Confluence as the primary chart system works best when combined with the Auto Support & Resistance Trading System to identify support and resistance levels, paired with either the Sigma · Top & Bottom Hunter or Zone · Heat Alert sub-chart systems. When price approaches critical support levels while the sub-chart systems simultaneously confirm bullish direction, the entire system achieves maximum confidence—making this the most compelling high-conviction entry opportunity.
⚠️ 核心原则一:周期越大,确定性越高
⚠️ Core Principle 1: The Higher the Timeframe, the Greater the Certainty
在使用这套系统时,时间周期的选择直接影响信号的可靠程度。月线的信号比周线更稳定,周线比日线更稳定,日线比4小时更稳定,4小时比1小时更稳定——越往下,灵敏度越高,但可靠性也相应下降。大周期适合用来判断整体趋势方向;小周期适合用来精细化入场时机、锁定利润、更早离场。两者结合使用,才是最完整的操作方式。
The timeframe you choose directly affects the reliability of the signals you receive. Monthly signals are more reliable than weekly, weekly more than daily, daily more than 4-hour, and 4-hour more than 1-hour — the further down you go, the more sensitive but less dependable the signals become. Higher timeframes are better suited for assessing the overall trend direction. Lower timeframes are useful for refining your entry timing, locking in profits, and exiting earlier. Using both together gives you the most complete picture.
八、利润最大化周期管理
Profit Maximization Through Timeframe Management
①如果持有的股票而短期升幅较大,也可以将周期调至较小的级别,更快发现信号,锁住更多利润。
①If the stock you are holding has risen significantly in the short term, you can also adjust down to a smaller timeframe to discover signals faster and lock in more profit.
②如果你的成本比较低而又有可观的升幅,如果你想捉到一个更长的升浪,可以找一个支撑点最多的小周期。只要小周期不跌穿大周期通道,便可继续持有,这样做的目的是不那么容易被震走,希望捉到一个长升浪,放大利润。这是在强势行情中保护利润、同时不过早离场的实用方法。例子请到投资学堂标题多系统共进实战图解里面有例子讲解。
②If your cost basis is low and you have meaningful gains, and you want to catch a longer-term upwave, you can select a smaller timeframe that offers the most support levels. As long as the smaller timeframe does not break below the larger timeframe channel, you can continue to hold. The purpose of this approach is to avoid being shaken out too easily and to capture a longer upwave to amplify profits. This is a practical method of protecting gains in strong markets while not exiting prematurely. Examples can be found in the Investment Academy under "Multi-System Resonance in Practice" with illustrated case studies.
推荐基础组合
Recommended Base Configuration
以下是一套推荐的基础组合供参考:
The following is a recommended base configuration for reference:
主图方面,选择任意一套自己用得顺手的主图交易系统,叠加智能支撑压力交易系统(Auto Support & Resistance Trading System),即可同时呈现关键支撑与阻力位,辅助判断进出场时机。
On the main chart, select any primary trading system that suits you, and layer it with the Auto Support & Resistance Trading System. This simultaneously displays key support and resistance levels, assisting your entry and exit timing decisions.
副图方面,建议同时添加主力猎手交易系统(Smart Money Hunter Trading System)与热度预警交易系统(Zone Trading System)。前者用于追踪主力资金的流入与流出动向,后者用于识别超买与超卖状态,两者配合可有效提升交易胜率。
On the sub-chart, it is recommended to add both the Smart Money Hunter Trading System and the Zone Trading System. The former tracks institutional money flow in and out, while the latter identifies overbought and oversold conditions. When combined, they can significantly improve your win rate.
找到适合自己的组合,比什么都重要。
Finding the combination that suits you matters more than anything else.
把Confluence加进你的图表,从今天开始只做最高确信度的交易。
Add Confluence to your chart. From today, trade only at the highest conviction.
写在最后
A Final Note
这套系统,以及我们平台上所有的交易系统,都没有唯一正确的用法。市场上没有任何一套方法能保证每次都对,也没有任何一种操作方式适合所有人。每个人的风险承受能力不同,性格不同,对亏损和利润的感受也不同——这些差异决定了你应该如何使用这些工具,而不是工具来决定你怎么做。
There is no single correct way to use this system — or any of the systems on our platform. No method is right every time, and no approach suits every trader. Your risk tolerance, your temperament, your emotional response to losses and gains — these define how you should use these tools, not the other way around.
所有交易系统的真正价值,是帮助你在面对市场时,用更有条理、更有依据的方式去做决定——在机会出现之前更早发现潜在的入场时机,在价格处于高位时更早收到风险提示,将复杂的市场信号转化为清晰可见的视觉语言,从而在结构上提高你的决策胜率。而不是靠情绪、靠感觉、靠运气。系统给你框架与视野,但判断永远是你自己的。
The true value of any trading system is to help you navigate the market with greater clarity and structure — spotting potential entry opportunities before they become obvious, receiving early risk warnings when price is extended at highs, and translating complex market signals into clear visual cues that structurally improve your decision-making. Not emotion. Not instinct. Not luck. The system gives you the framework and the visibility. The judgment is always yours.
找到一套你真正用得舒服、能够坚持执行的方法,比追求"最完美的系统"更重要。那套方法,才是真正属于你的交易体系。
Finding an approach you are genuinely comfortable with — one you can commit to and execute consistently — matters far more than chasing the perfect system. That approach, built around who you are as a trader, is your real edge.
本文内容仅供参考,不构成任何投资建议。投资涉及风险,过去表现不代表未来回报。请在作出任何投资决定前咨询持牌投资顾问。
This content is for reference only and does not constitute investment advice. Investing involves risk. Past performance is not indicative of future returns. Please consult a licensed investment adviser before making any investment decisions.