智能支撑压力交易系统 · Auto Support & Resistance Trading System
价格的记忆比你想象的更长。支撑和阻力,是市场留下最深的两道印记。
Price has a longer memory than most traders realize. Support and resistance are the two deepest marks the market leaves behind.
大多数散户凭感觉画支撑线和阻力线,画错了不知道,画对了也不确定。Auto Support & Resistance Trading System · 智能支撑压力交易系统由财富俱乐部量化分析团队打造,用算法自动识别图表上真正有意义的支撑位与阻力位,并在价格突破或跌破这些关键位置时自动发出信号——让你不再凭感觉画线,让每一条线都有数据支撑。
Most retail traders draw support and resistance lines by feel — wrong without knowing it, right without being sure. The Auto Support & Resistance Trading System · 智能支撑压力交易系统, built by the Wealth Club quantitative analysis team, uses an algorithm to automatically identify genuinely meaningful support and resistance levels on the chart, and automatically signals when price breaks through or falls below these key levels — so you never draw lines by guesswork again, and every line has data behind it.
无需成为图表专家,强大的算法自动为你绘制所有关键信息。适用于股票、加密货币、外汇和商品等任何金融市场,支持1m、5m、15m、1h、4H、1D等所有主流时间框架。无论你是日内交易者、波段交易者还是趋势交易者,Auto Support & Resistance都能为你精准标注市场的关键价格区域,让你像机构一样进行交易。
No need to be a chart expert. Our powerful algorithm automatically plots all key information for you. Compatible with any financial market — stocks, crypto, forex, and commodities — across all major timeframes including 1m, 5m, 15m, 1h, 4H, and 1D. Whether you're a day trader, swing trader, or trend trader, Auto Support & Resistance precisely marks the market's key price zones so you can trade like an institution.

这套系统做了什么?
What does this system do?
财富俱乐部量化分析团队通过以下四个维度构建这套系统:
深度量化研究公司财务数据
K线与趋势技术指标分析
机构主力资金流向监测
大数据与AI驱动的多因子模型
The Wealth Club quantitative analysis team built this system across four dimensions:
In-depth quantitative research of company financial data
Candlestick and trend technical indicator analysis
Institutional capital flow monitoring
Big data and AI-driven multi-factor model
在上述四个维度的基础上,Auto Support & Resistance系统额外整合了多周期价格结构枢纽识别算法(Multi-Period Price Structure Pivot Detection)与突破有效性筛选模型(Breakout Validity Filtering)。前者通过扫描价格在一定周期内的高低点结构,精确锁定市场在统计意义上反复确认的关键价格区域——这些区域正是机构资金在历史上反复进出的位置;后者则通过评估突破时的收盘价位置与方向,过滤假突破信号,只在价格真正完成有效突破时才发出提示。
In addition to the four core dimensions, the Auto Support & Resistance system further integrates a Multi-Period Price Structure Pivot Detection Algorithm and a Breakout Validity Filtering Model. The former scans the high and low structure of price over a defined period to precisely lock in key price zones that the market has repeatedly confirmed on a statistical basis — these are the exact zones where institutional capital has historically entered and exited. The latter evaluates the closing price position and direction at the moment of breakout, filtering false breakout signals and only alerting when price has genuinely completed a valid move through a key level.
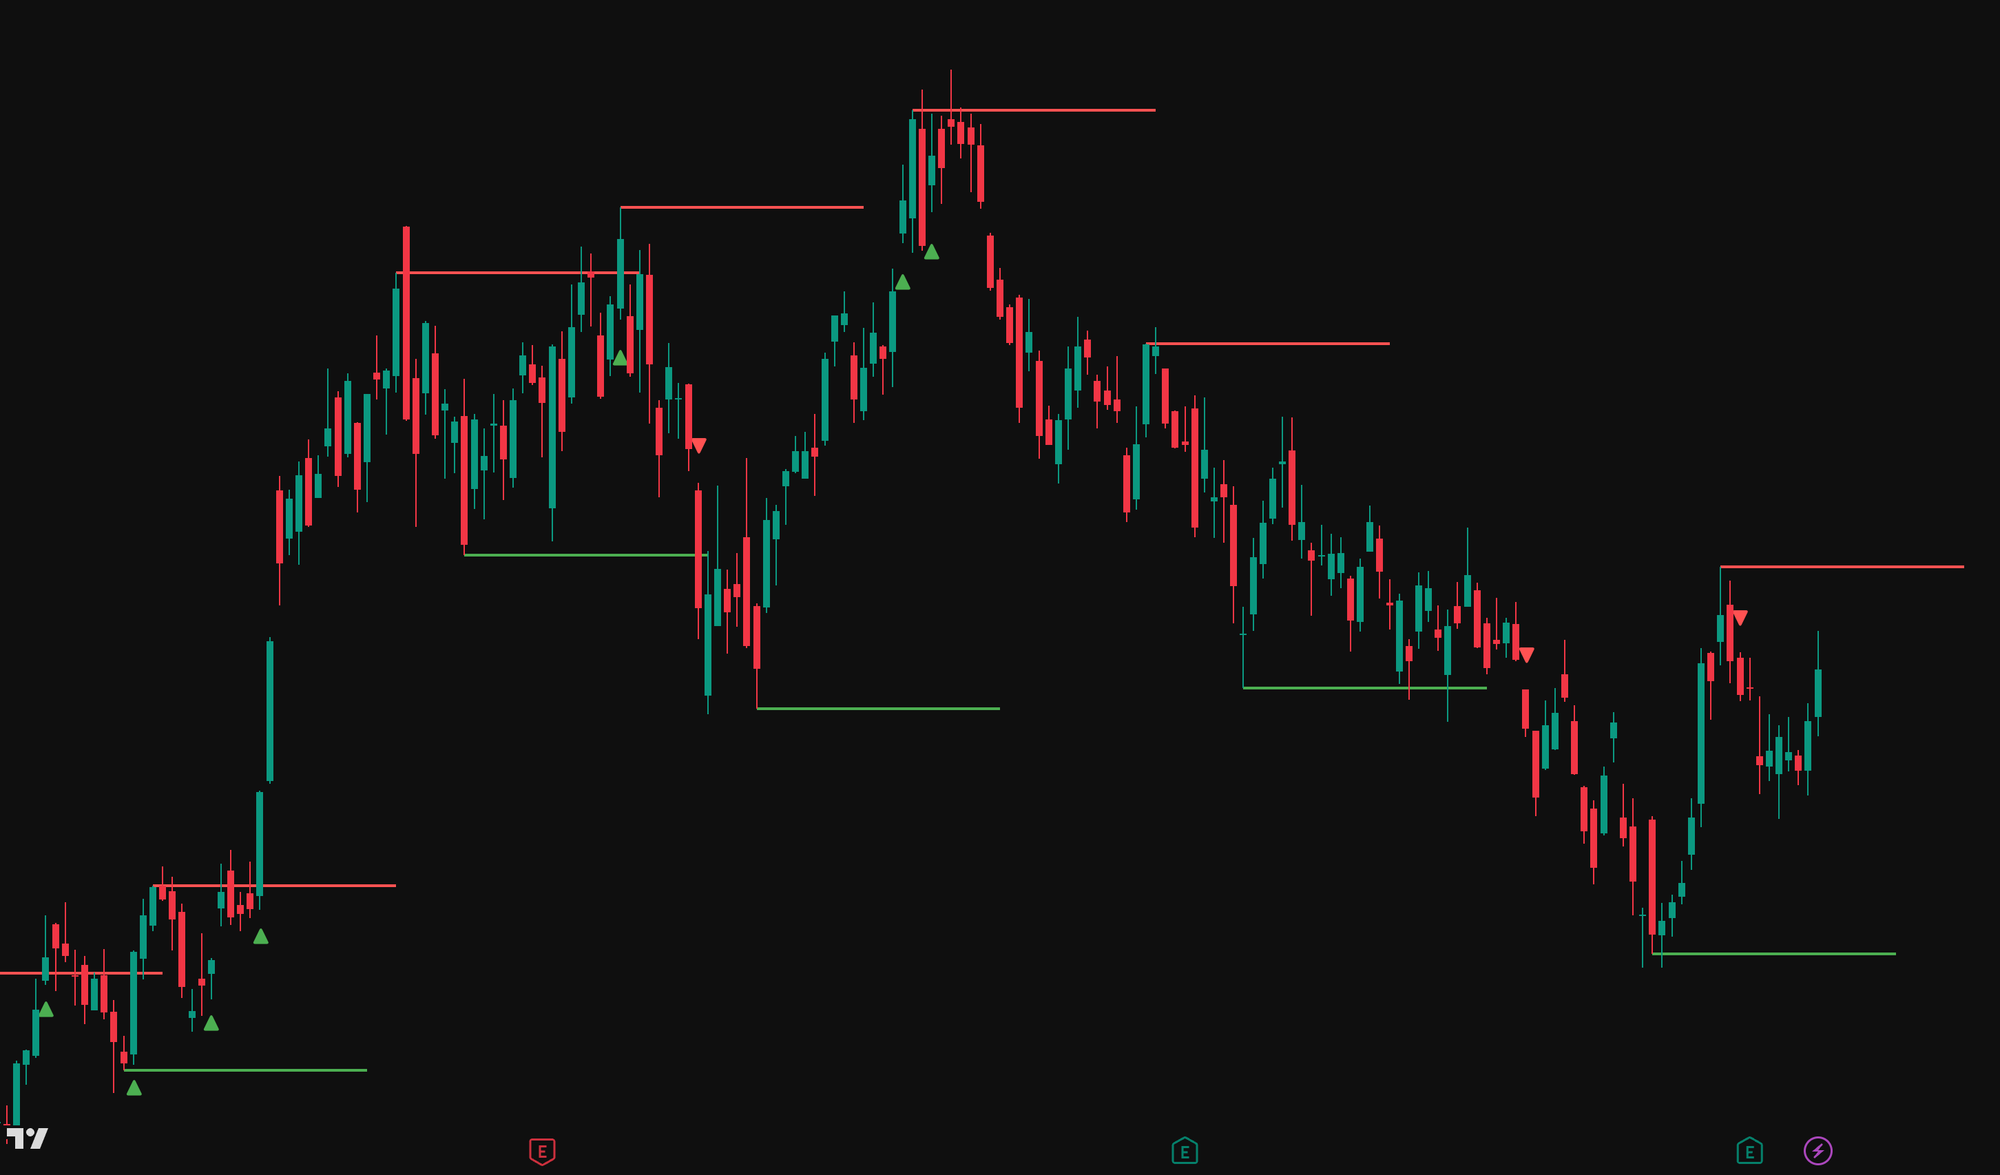
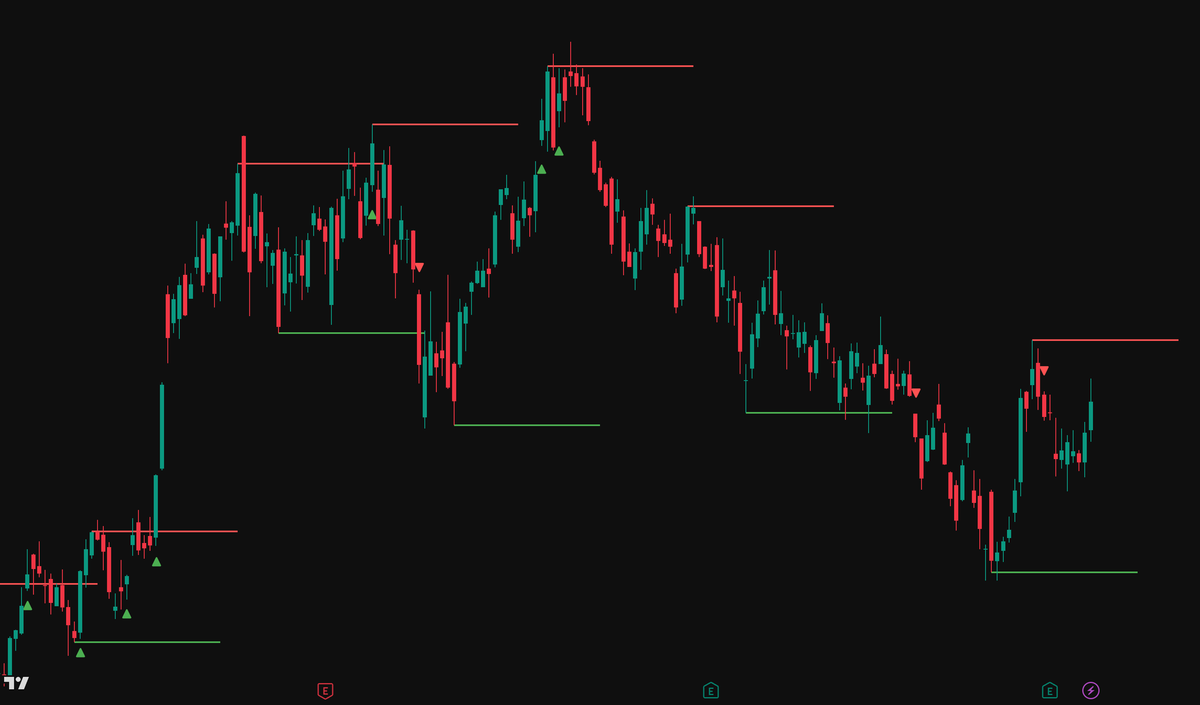
Auto Support & Resistance在主图上自动绘制两类关键价格线,并在突破时发出信号。红色水平线标注阻力位——价格在此区域曾多次遭遇卖压,是市场的历史高点结构;绿色水平线标注支撑位——价格在此区域曾多次获得买盘支撑,是市场的历史低点结构。当价格向上突破阻力位,图表自动出现绿色向上箭头▲;当价格向下跌破支撑位,图表自动出现红色向下箭头▼。
Auto Support & Resistance automatically plots two types of key price lines on the main chart and signals at breakout moments. Red horizontal lines mark resistance levels — zones where price has previously encountered selling pressure multiple times, representing historical high-point structure. Green horizontal lines mark support levels — zones where price has previously received buying support multiple times, representing historical low-point structure. When price breaks upward through a resistance level, a green upward arrow ▲ automatically appears on the chart. When price breaks downward through a support level, a red downward arrow ▼ appears.
最终呈现在你面前的,只有两件事:图表上自动绘制的支撑位与阻力位,和突破时出现的方向信号。
What's presented to you is simple: automatically plotted support and resistance levels on the chart, and directional signals when those levels are broken.
🟢 绿色水平线 → 支撑位,价格在此获得买盘
🟢 Green horizontal line → Support level, where price finds buying support
🔴 红色水平线 → 阻力位,价格在此遭遇卖压
🔴 Red horizontal line → Resistance level, where price encounters selling pressure
▲ 绿色向上箭头 → 有效突破阻力位,潜在买入机会
▲ Green upward arrow → Valid breakout above resistance, potential buy opportunity
▼ 红色向下箭头 → 有效跌破支撑位,潜在减仓提示
▼ Red downward arrow → Valid breakdown below support, potential reduction alert
订阅后即可解锁Auto Support & Resistance完整使用指南,包括:
Subscribe to unlock the complete Auto Support & Resistance usage guide, including:
如何结合支撑位和阻力位判断入场时机,突破确认后应该如何配合仓位管理。
How to use support and resistance levels to time entries, and how to manage position sizing after a breakout is confirmed.
哪个时间周期效果最好,日线、周线、小时线各有什么不同用法。
Which timeframe works best — how daily, weekly, and hourly charts each serve a different purpose.
如何避免假突破,▲和▼信号出现后应该观察哪些确认条件再行动。
How to avoid false breakouts, and what confirmation conditions to observe before acting on ▲ and ▼ signals.
如何配合Sigma · 顶底捕捉交易系统或Zone · 热度预警交易系统共同确认,形成更高胜率的交易决策。
How to combine with the Sigma · Top & Bottom Detection Trading System or Zone · Heat Alert Trading System for confirmation, building higher win-rate trading decisions.
量化交易信号系统 · 完整交易生态系统
Quantitative Trading Signal Systems · A Complete Trading Ecosystem
我们提供的,从来不只是一套买卖信号工具。
What we offer has never been just a set of buy and sell signal tools.
订阅会员可获得完整访问权限,包括:
Subscribing members receive full access to:
交易机会报告
Trading opportunity reports
深度研究报告
Deep research reports
潜力名单
Potential watchlist
核心名单
Core watchlist
多套专业核心交易系统完整使用权
Full access to multiple professional core trading systems
Smart Money Hunter Trading System · 主力猎手交易系统
Long-Short Trading System · 多空交易系统
Cycle Trading System · 周期转折交易系统
Options & Day Trading System · 期权及日内交易系统
由于TradingView平台新规,对私密的、只限邀请制的交易指标脚本实施了更严格的审核新规,并且对指标数量与描述方式等各方面都提出了严格要求,因此具体的交易系统数量会随着平台的审核决定而有所变动。
Due to TradingView's new platform rules, stricter review requirements have been implemented for private, invite-only trading indicator scripts, with strict requirements around the number of scripts and other aspects of their descriptions. As a result, the exact number of available trading systems may fluctuate depending on the platform's review decisions.
但请大家放心——实际上,只要有一到两个优质的交易指标,就已经足以做出良好的判断,因为这些指标的核心原理和底层数据,反映的都是最重要的关键信息,所以它们背后的使用逻辑其实大同小异。指标数量并不是越多越好,过去我们开发出多种不同效果的指标,单纯是希望给会员更多选择,所以指标数量的多少,其实并不影响实际使用效果。
But please rest assured — in practice, having just one or two good trading indicators is already enough to make sound judgments, because the core principles and underlying data of these indicators reflect the most important information anyway, so the underlying logic behind how they're used is largely similar. More indicators isn't necessarily better — we developed indicators with different effects in the past simply to give members more choice, so the number of available indicators doesn't actually affect how well they work.
因此,以下这些交易系统目前暂时无法通过平台直接授权。如你希望进一步了解这些系统的使用方式,欢迎发送邮件与我们联系。
As a result, the following trading systems are currently unavailable for direct authorization through the platform. If you would like to learn more about how to access these systems, please feel free to email us.
主图系统 · Main Chart Systems
QuantFlow Trading System · 量化趋势交易系统
Apex Pro Trading System · 巅峰交易系统
Apex Trading System · 顶点交易系统
Confluence Trading System · 共振交易系统
Confluence Pro Trading System · 共振进阶交易系统
Pivot Trading System · 高低点捕捉交易系统
Momentum Dynamic Trading System · 动能交易系统
Alpha Quantitative Trading System · Alpha量化交易系统
Reversal Pro Trading System · 反转捕捉进阶交易系统
Top & Bottom Trading System · 逃顶抄底交易系统
Auto Support & Resistance Trading System · 智能支撑压力交易系统
NX Bull Bear Hunter Trading System
副图系统 · Sub Chart Systems
Trail Trading System · 轨迹信号交易系统
Dot Trading System · 点位信号交易系统
Rainbow Trading System · 彩虹趋势交易系统
Force Trading System · 多空动能交易系统
Radar Trading System · 雷达交易系统
Flow Trading System · 顺势交易系统
Duel Trading System · 多空对决交易系统
Zone Trading System · 热度预警交易系统
Sigma Trading System · 顶底捕捉交易系统
Reversal Trading System · 反转捕捉交易系统
Top & Bottom Hunter Trading System · 顶底猎手交易系统
CD Top & Bottom Trading System · CD 抄底 & 逃顶进阶交易系统
部分标的自入选以来已录得超过+300%至+700%回报。
Some selections have returned over +300% to +700% since inclusion.
我们的价格 · Our Pricing
月费:$68每月
Monthly plan: $68/month
年费:$38每月 · $456每年(较月费节省44%)
Annual plan: $38/month · $456/year (save 44% versus monthly)
以年费计算,每天实际成本仅$1.25——比一杯普通咖啡还便宜,换来的是完整的交易机会报告、深度研究、精选名单,以及核心交易系统的使用权。
On the annual plan, your actual daily cost is just $1.25 — less than the price of a regular cup of coffee — in exchange for full trading opportunity reports, in-depth research, curated watchlists, and access to our core trading systems.
现在就是时候 | The Time Is Now
大多数人等待"完美时机"入场——但完美时机永远不会来。真正的机会,从来只属于提前布局的人。市场不等人。现在加入的人,看到的永远比后来者多一步。
Most people wait for the "perfect moment" to act — but that moment never arrives. Real opportunity has always belonged to those who position ahead of it. The market does not wait. Those who act now will always be one step ahead.
🎁 早鸟限时优惠 · 月费:$68每月 — 优惠期结束后恢复原价每月$88。
🎁 早鸟限时优惠 · 年费:$38每月 · $456每年 — 优惠期结束后恢复原价每月$58 · $696每年。
🎁 Early Bird Special · Monthly plan: $68/month — Price will return to $88/month after the promotional period ends.
🎁 Early Bird Special · Annual plan: $38/month · $456/year — Price will return to $58/month · $696/year after the promotional period ends.
Subscribe now and lock in your early bird rate.
这不只是一个订阅,而是一个持续成长的平台。团队将持续因应市场变化、科技发展及交易研究的最新成果,不断添加更多增值内容。与此同时,现有的交易系统将持续整合AI与机器学习技术,不断强化信号精准度与市场适应能力。团队也会持续研发全新的交易系统,所有新系统上线后,现有会员均可同步免费使用。
This is not simply a subscription — it is a platform that grows with you. The team will continuously add new value-added content in response to market developments, technological advancements, and the latest research. At the same time, existing trading systems will be continuously enhanced through the integration of AI and machine learning, improving signal precision and adaptability across different market conditions. The team is also actively developing new trading systems — and as each one launches, all existing members will have free access automatically.
我们已经见证了许多会员从零开始,逐步摸索出一套真正适合自己的交易战法,并在市场中取得了属于自己的成果。不少会员在我们的核心名单与交易机会标的上取得了+300%至+700%以上的成绩。希望接下来,我们能见证更多会员的成长故事。
We have already seen many members start from scratch, gradually develop a trading approach that truly suits them, and achieve results of their own in the market. A number of members have achieved gains of +300% to +700% and beyond on positions from our Core Watchlist and Trading Ideas. We look forward to witnessing many more member success stories in the chapters ahead.
每一位今天加入的会员,都将是这一切成长的受益者。市场不等人,系统越早用越熟,优势越早建立。你开始的那一天,就是你与其他散户拉开距离的那一天。
Every member who joins today will be among the first to benefit from everything that comes next. The market does not wait. The earlier you build your system, the earlier you build your edge. The day you start is the day you begin pulling ahead.