Complete Quantitative Trading Systems Overview
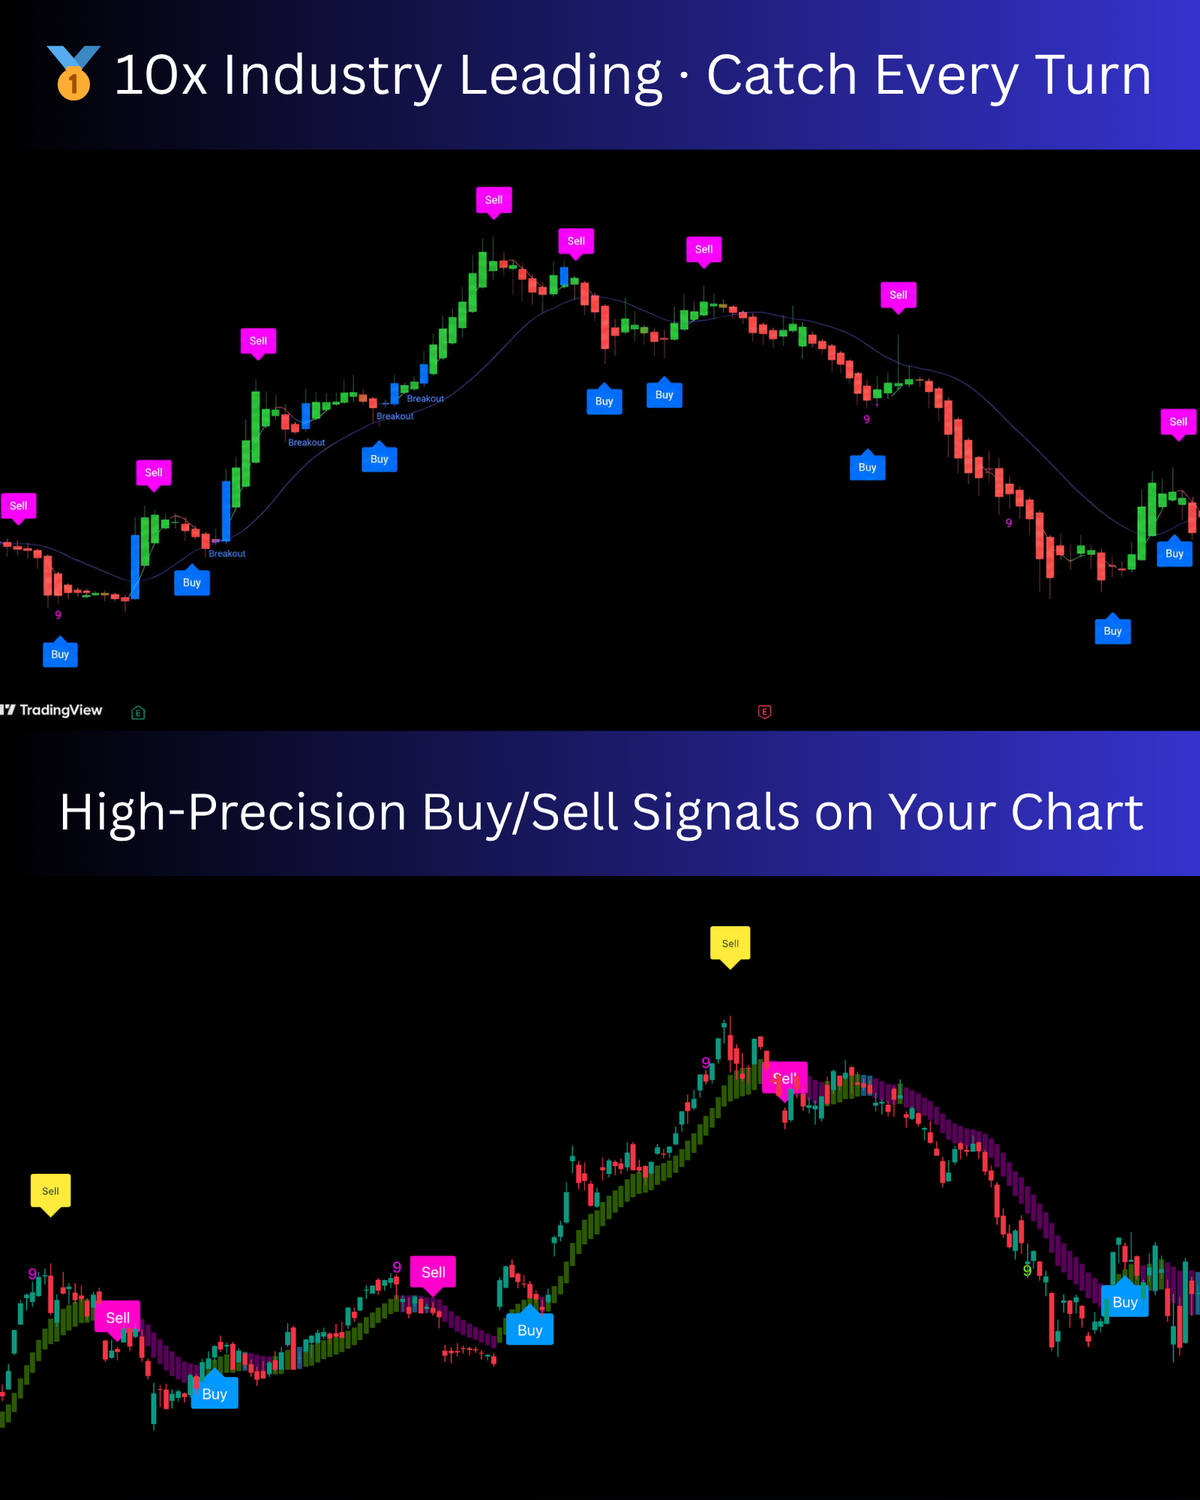
🥇 行业领先10倍精准度 · 捕捉每一个转折点
🥇 10x Industry Leading · Catch Every Turn
⠀
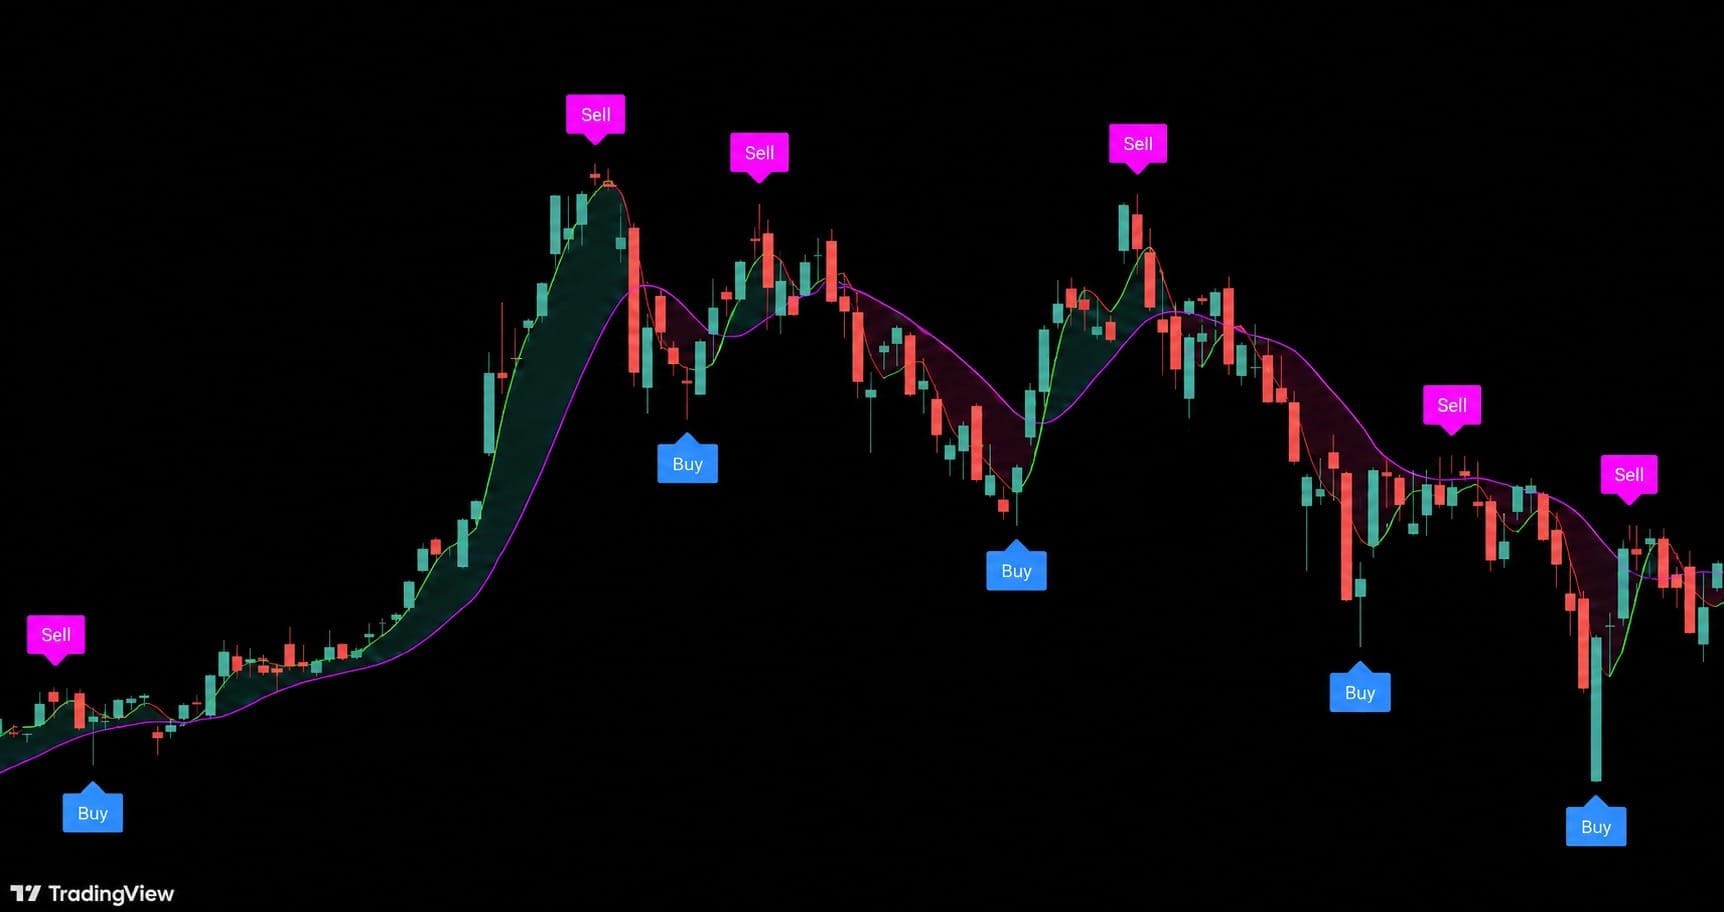
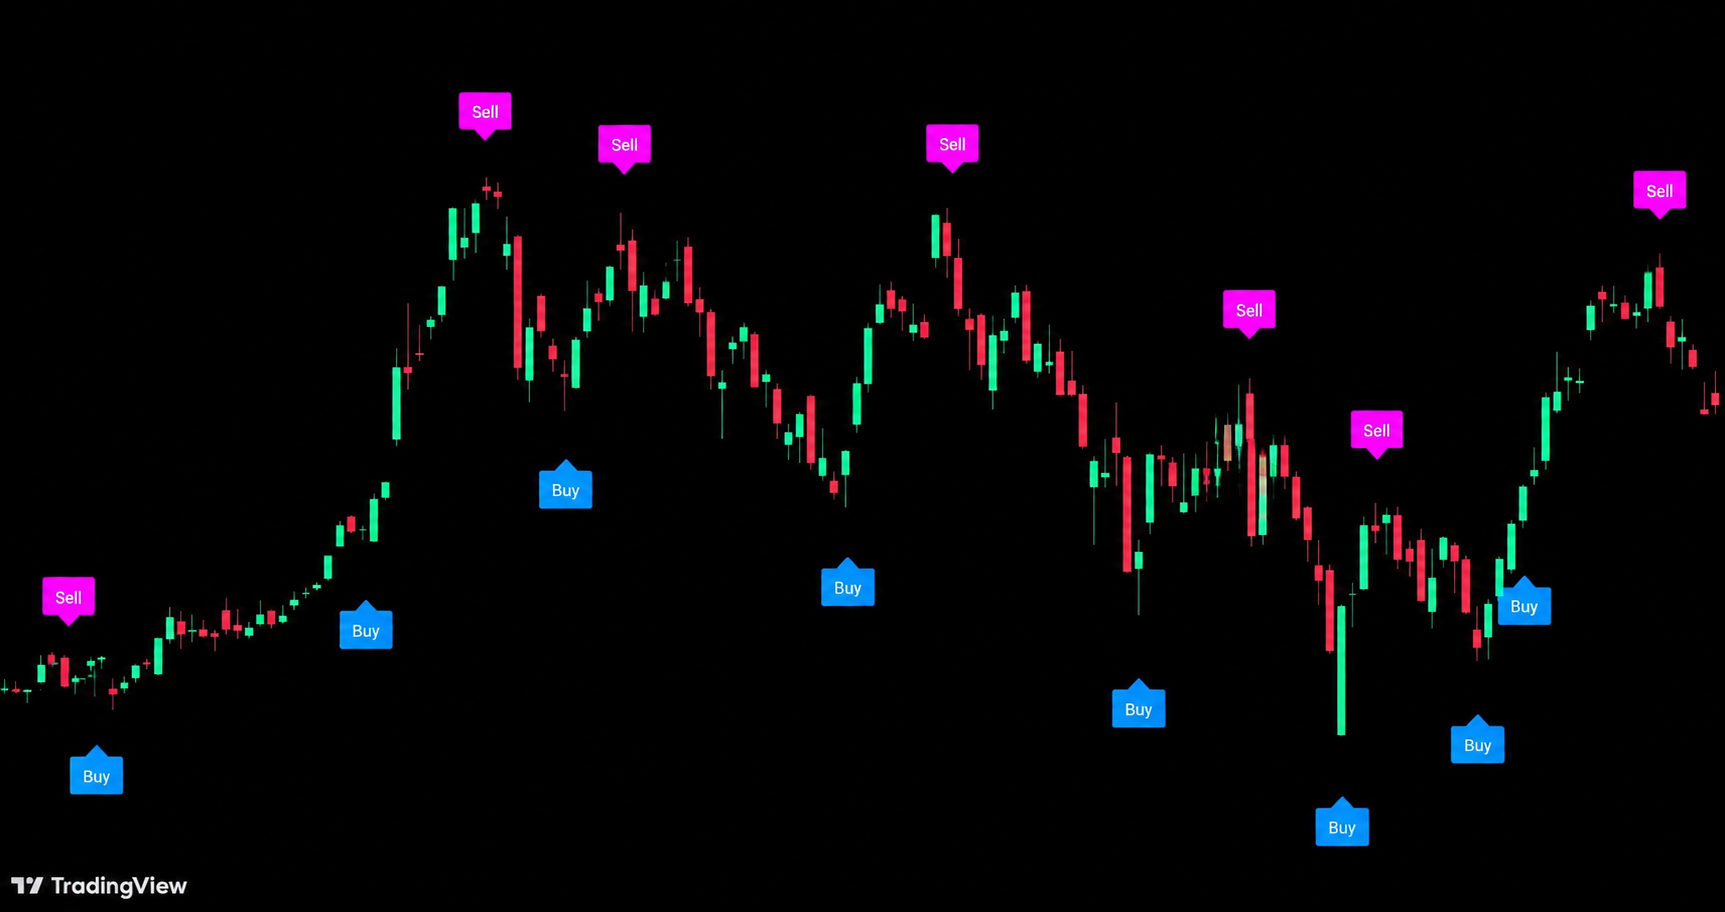
高精准Buy/Sell信号直接显示在K线图上
High-Precision Buy/Sell Signals on Your Chart
⠀
多套不同功能量化交易系统,零门槛无需编程技能,一键即用。
Multiple quantitative trading systems with different functions. Zero threshold — no programming skills required, one-click setup.
⠀
强大AI与大数据驱动,整合趋势因子及机构主力资金流向监测,形成更高胜率的交易系统。抓高低点、识别趋势反转,准确度提升到另一个境界。
Powered by advanced AI and big data, integrating trend factors and institutional capital flow monitoring to deliver higher-probability trading signals. Pinpoint highs and lows, identify trend reversals — precision taken to another level.
⠀
覆盖股票 · 加密货币 · 外汇 · 商品期货 · 零门槛一键即用。
Covers Stocks · Crypto · Forex · Commodities · Zero threshold, one-click setup.
⠀
不需要分析,只需要执行。
No analysis needed. Just execute.
⠀
财富俱乐部目前提供24套量化买卖信号交易系统,涵盖主图与副图指标。交易系统均基于AI机器学习量化模型持续优化,系统数量将随优化进程动态调整。系统涵盖趋势追踪、周期转折、动能捕捉、智能支撑压力等多种核心交易逻辑,以下为各系统的功能概览及使用方法。
Wealth Club currently offers 24 quantitative buy/sell signal trading systems, covering both main-chart and sub-chart indicators. All systems are continuously optimized through AI machine learning models, and the number of systems will expand dynamically as development progresses. Covering trend tracking, cycle reversals, momentum signals, and intelligent support/resistance detection — below is a functional overview and usage guide for each system.
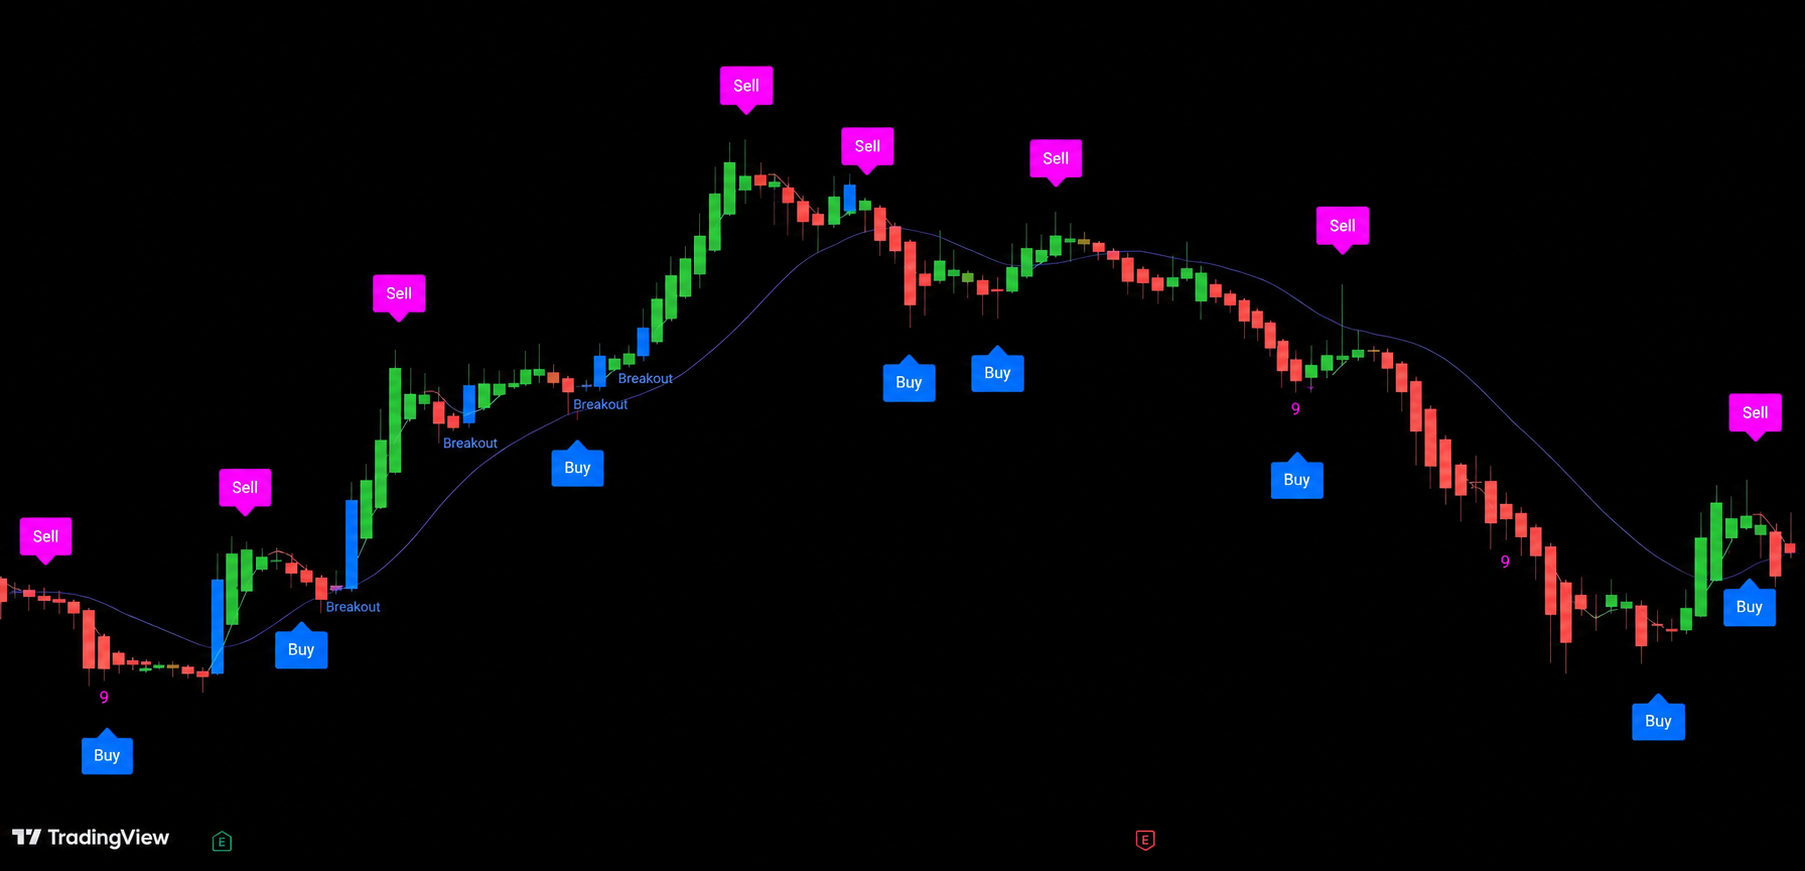
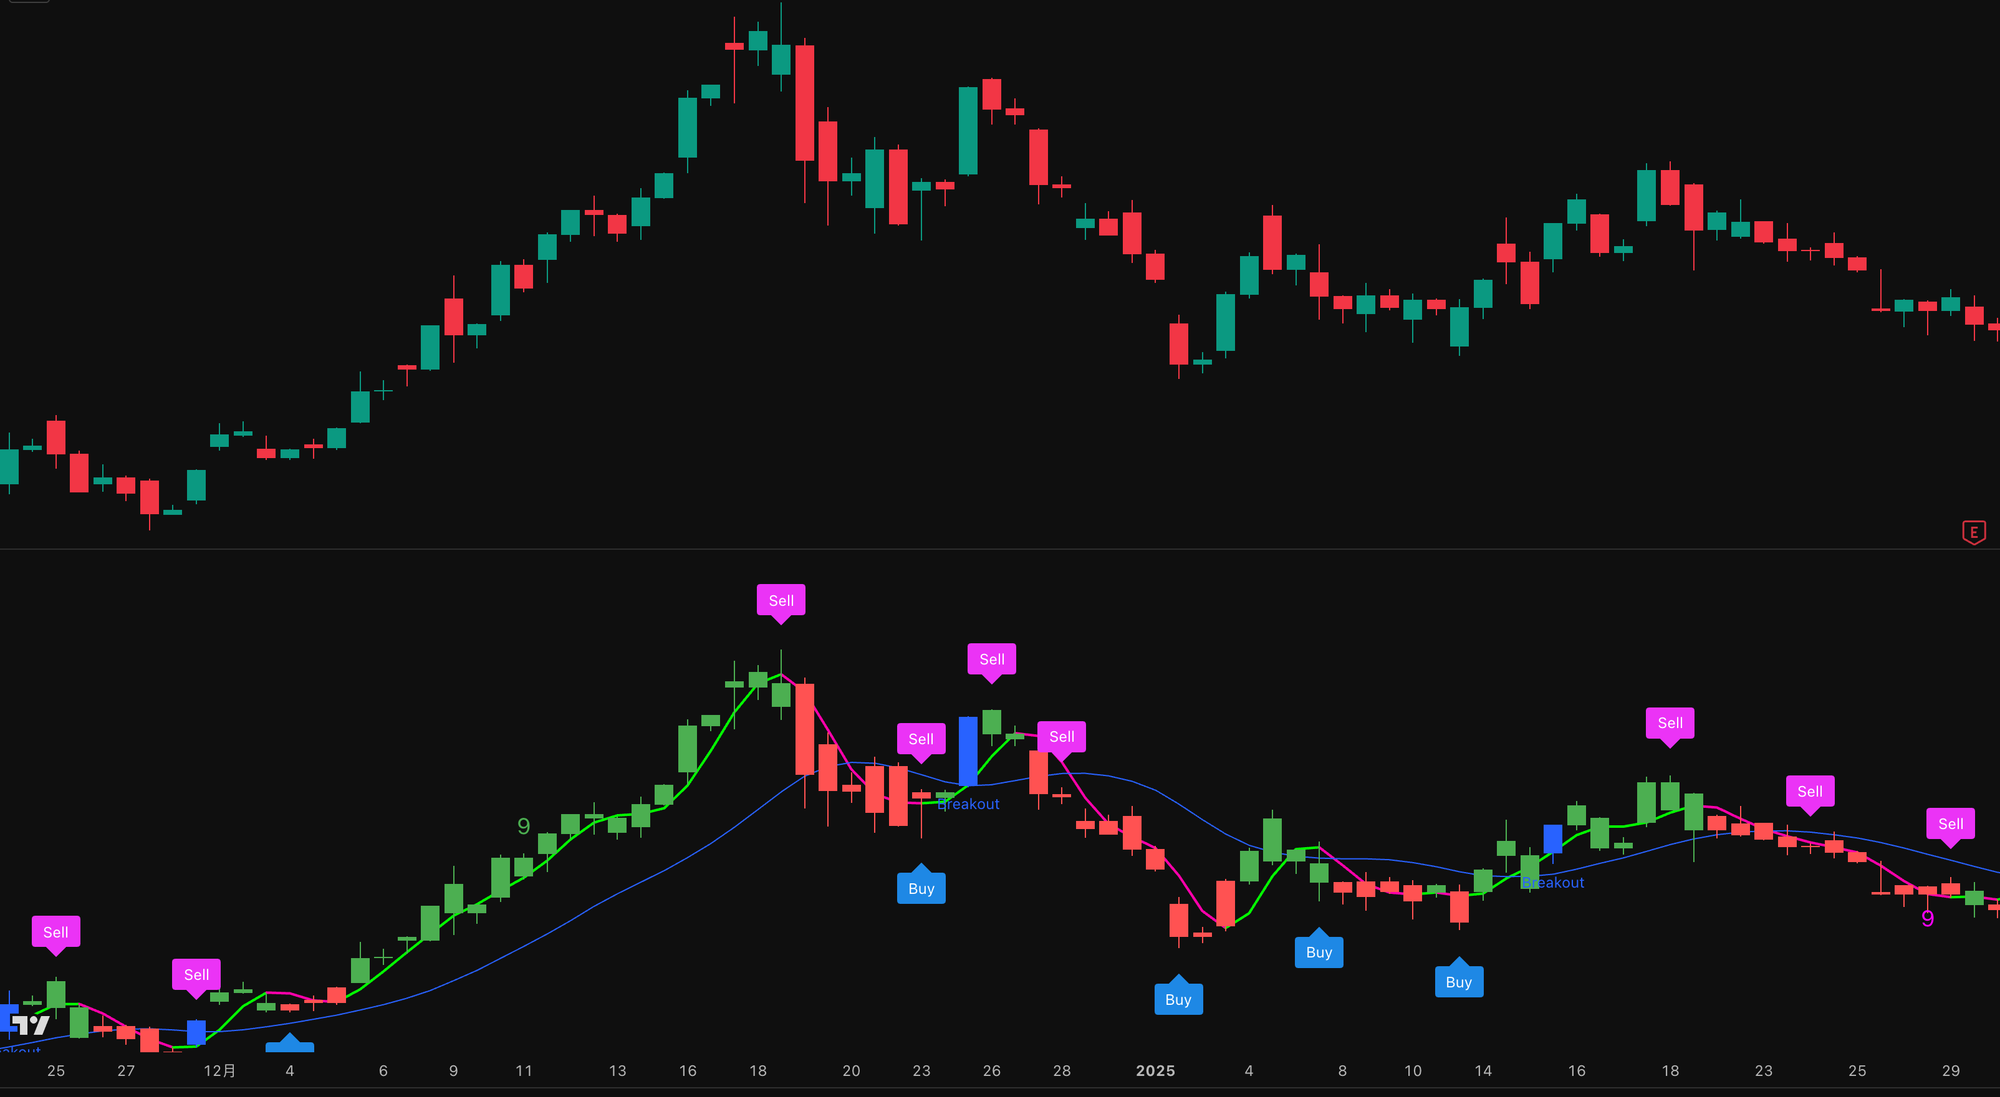
周期转折交易系统 . Cycle Trading System
【主图 · Main Chart】
当大多数人还在一根一根K线里猜方向,Cycle Trading System已经先把趋势、节奏和拐点切分出来了。
While most traders are still guessing direction candle by candle, the Cycle Trading System has already mapped out the trend, rhythm, and turning points for you.
市场里真正难的,从来不是看见涨跌,而是分清楚眼前这段上涨到底只是反弹,还是一段能继续推进的趋势;眼前这段下跌到底只是洗盘,还是结构已经开始转弱。多数散户之所以反复追高杀低,不是因为不努力,而是因为他们看到的只是价格本身,却看不到价格背后的节奏切换、趋势延续和转折质量。
The real difficulty in trading is not seeing price move. It is knowing whether the move in front of you is merely a bounce or the beginning of a trend that can continue. Most retail traders keep chasing highs and panic-selling lows not because they do not work hard enough, but because they only see price itself and not the rhythm shift, trend continuation, and turning-point quality behind it.
Cycle Trading System · 周期转折交易系统由财富俱乐部量化分析团队打造,把复杂的趋势结构、转折节奏、关键拐点和突破确认,压缩成主图上一套更直观的可视化信号。你看到的不再只是K线,而是K线背后的市场状态。
Built by the Wealth Club quantitative analysis team, the Cycle Trading System · 周期转折交易系统 compresses complex trend structure, turning rhythm, key pivots, and breakout confirmation into a cleaner visual framework directly on the main chart. What you see is no longer just candles. You see the condition behind price.
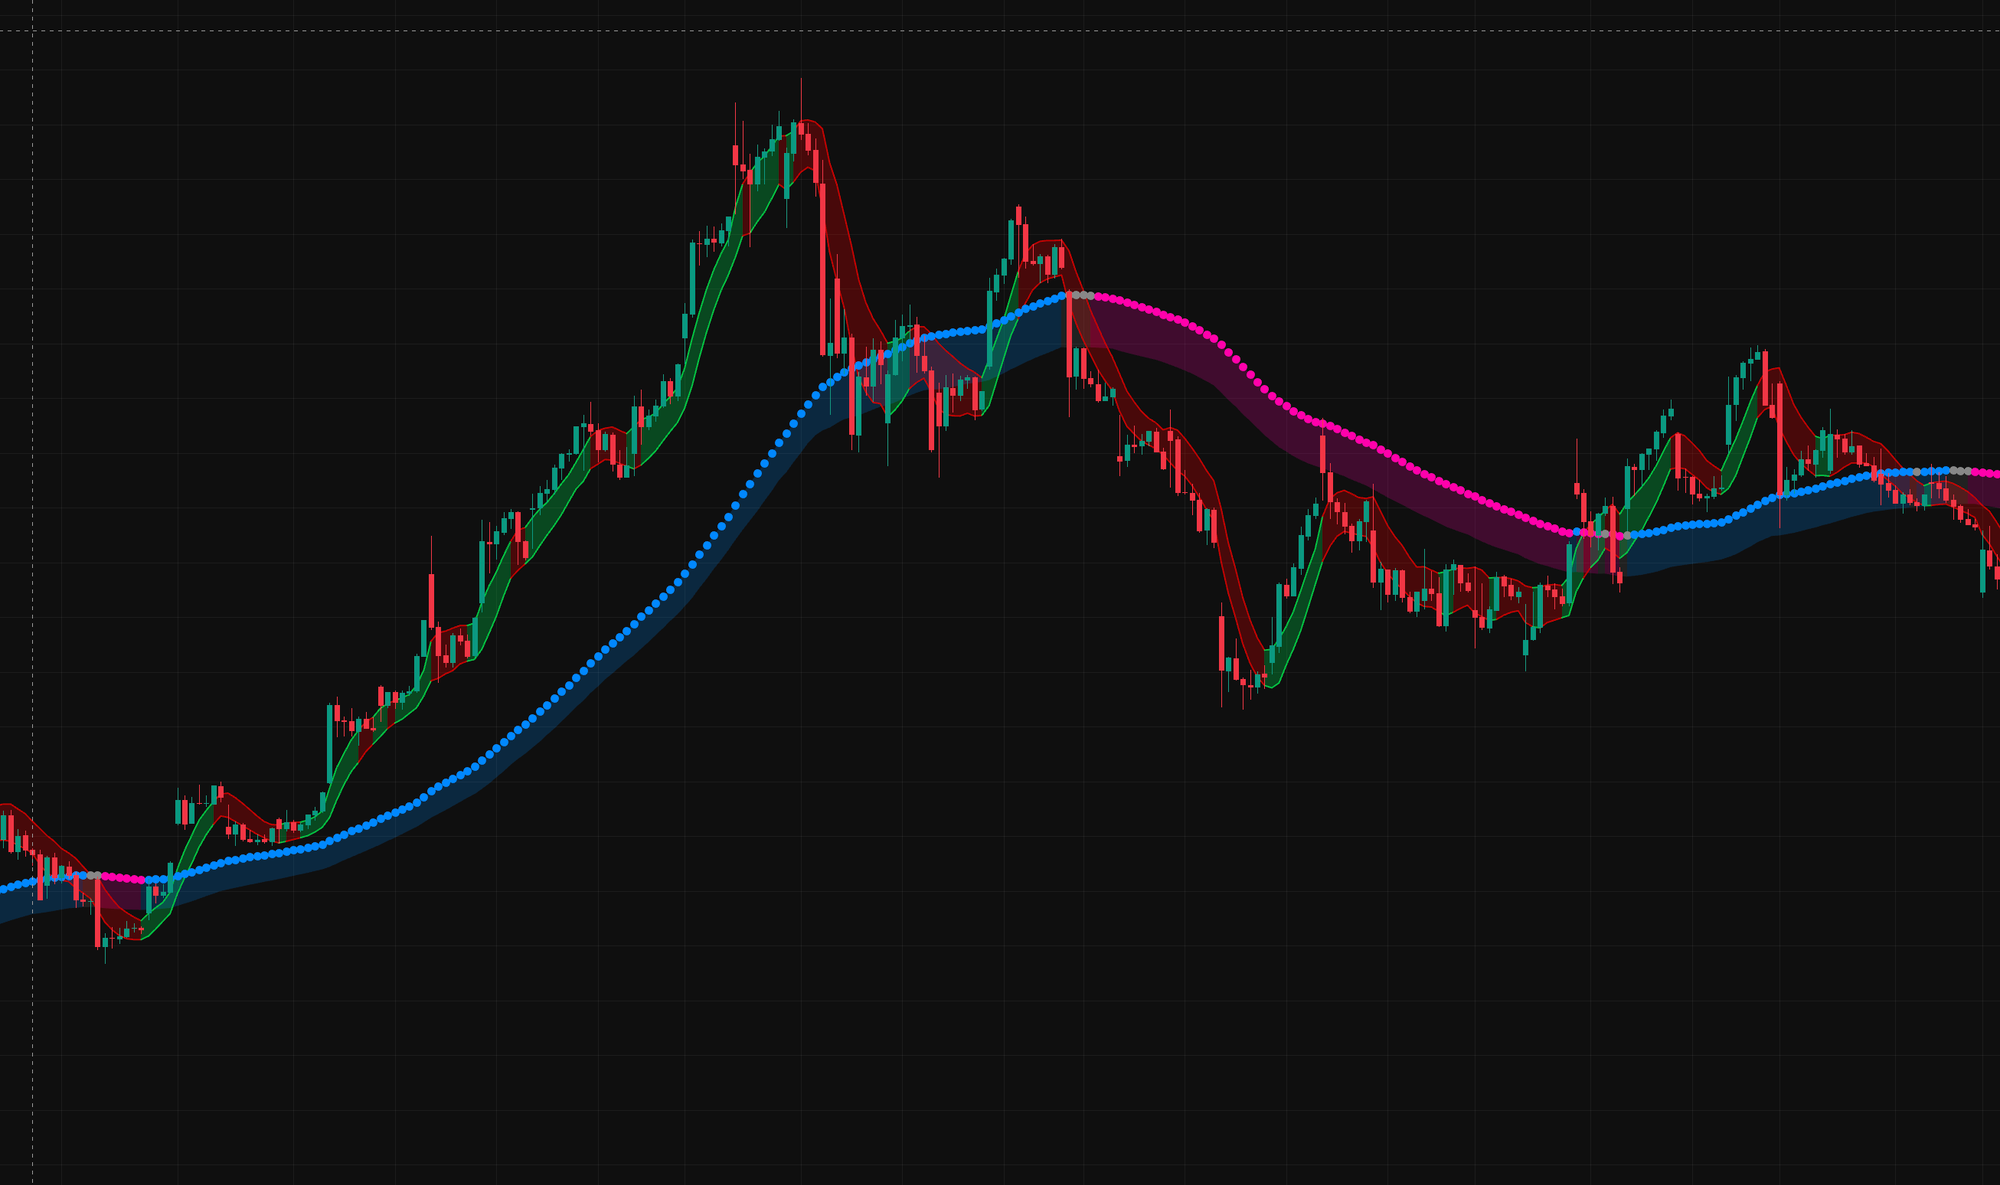
这套系统不靠花哨的副图堆砌信息,而是直接在主图上完成判断。图表上最核心的元素只有几项:一条更敏感的短周期动能线、一条更平稳的中周期基准线、关键高低点附近自动出现的Buy / Sell提示、节奏极值附近出现的"9"字提醒,以及在关键结构突破时出现的Breakout标记。信息不多,但足够做决定。
The system does not rely on cluttered sub-chart noise. It makes the decision framework visible directly on the main chart. Its core elements are simple: a more sensitive short-cycle momentum line, a steadier medium-cycle baseline, automatic Buy / Sell prompts around key turning areas, a "9" marker near rhythm extremes, and a Breakout label when structure confirms a key move. It is not a lot of information, but it is enough to make decisions.
它适用于股票、加密货币、外汇和商品等各类金融市场,支持1m、5m、15m、1h、4H、1D等主流时间框架。无论你是日内交易者、波段交易者还是趋势交易者,Cycle Trading System都会让你更快看清市场现在是启动、延续、衰减,还是正在准备转向。
It works across stocks, crypto, forex, and commodities, and across major timeframes including 1m, 5m, 15m, 1h, 4H, and 1D. Whether you trade intraday, swings, or broader trends, the Cycle Trading System helps you read whether the market is initiating, continuing, weakening, or preparing to turn.
这套系统做了什么?
What does this system do?
财富俱乐部量化分析团队通过以下四个维度构建这套系统:
多周期价格斜率与趋势结构识别
关键高低点与转折节奏捕捉
趋势延续强度与衰减阶段监测
结构突破与失败突破筛选
The Wealth Club quantitative analysis team built this system across four dimensions:
Multi-timeframe price slope and trend-structure recognition
Key pivot and turning-rhythm detection
Trend continuation strength and exhaustion-stage monitoring
Breakout and failed-breakout filtering
在这四个维度之上,Cycle Trading System进一步把短线节奏和中线方向放在同一张主图里同时呈现。绿色与粉红色线段,告诉你短周期动能当前偏向哪一边;蓝色基准线,告诉你中周期趋势主方向是否仍然稳固;Buy与Sell,告诉你关键拐点附近哪里值得开始行动;"9"字提醒,则用来提示你当前这段连续节奏已经运行了相当一段距离,风险收益比正在发生变化。
On top of these four dimensions, the Cycle Trading System presents short-term rhythm and medium-term direction on the same main chart. The green and pink line segments show which side short-cycle momentum currently favors. The blue baseline shows whether the medium-cycle trend still holds. Buy and Sell indicate where action becomes meaningful around key pivots. The "9" marker warns that a sustained rhythm leg may already be extended and that the risk-reward profile is starting to change.
最终呈现在你面前的,只有几件真正有价值的事:趋势方向、节奏切换、关键拐点、极值提醒,以及图表上的Buy / Sell。
What ultimately appears in front of you is simple: trend direction, rhythm transition, key turning points, exhaustion alerts, and Buy / Sell directly on the chart.
🟢 绿色 → 短周期动能修复,买入机会
🟢 Green → Short-cycle momentum repairing, buy opportunity
🩷 粉红色 → 短线动能降温,卖出机会
🩷 Pink → Short-term momentum cooling, sell opportunity
订阅后即可解锁Cycle Trading System完整使用指南,包括:
Subscribe to unlock the complete Cycle Trading System usage guide, including:
具体怎么用这套系统进行买卖决策,包括信号出现后应该如何配合仓位管理。
Exactly how to use this system for buy and sell decisions, including position sizing after a signal appears.
哪个时间周期效果最好,日线、周线、小时线各有什么不同用法。
Which timeframe works best — how daily, weekly, and hourly charts each serve a different purpose.
如何避免假信号,什么情况下Buy信号应该忽略。
How to avoid false signals and when a Buy signal should be ignored.
"9"字提醒在不同趋势阶段分别意味着什么,什么时候只是提醒,什么时候价值更高。
What the "9" marker means at different stages of a trend, and when it matters more.
Breakout提示什么时候值得跟,什么时候应该放弃。
When a Breakout label is worth following and when it should be ignored.
如何配合Auto Support & Resistance Trading System · 智能支撑压力交易系统的支撑位与压力位,以及Sigma · 顶底捕捉交易系统或Zone · 热度预警交易系统共同确认,形成更高胜率的交易系统。
How to combine with the support and resistance levels from the Auto Support & Resistance Trading System · 智能支撑压力交易系统, and confirmation from the Sigma · Top & Bottom Detection Trading System or Zone · Heat Alert Trading System, to build a higher win-rate trading system.
如何在TradingView上获得这个指标的专属授权,直接在你自己的账户上实时使用。
How to obtain exclusive TradingView access to run this indicator live in your own account.
25 套量化交易信号系统 · 完整交易生态系统
25 Quantitative Trading Signal Systems · A Complete Trading Ecosystem
交易系统均基于AI机器学习量化模型持续优化,系统数量将随优化进程动态调整。
All trading systems are continuously optimized through AI-driven machine learning and quantitative modelling. The number of systems is subject to change as optimization evolves.
我们提供的,从来不只是一套买卖信号工具。
What we offer has never been just a set of buy and sell signals.
Wealth Club 构建的是一个完整的交易生态系统——25 套量化买卖信号交易系统、深度研究报告、交易机会报告、核心持仓名单、高潜力名单、市场简报、市场前瞻与投资学堂,七大模块有机结合,覆盖从宏观研判到精准入场的完整交易闭环。
Wealth Club is built around a complete trading ecosystem — 25 quantitative signal trading systems, deep research reports, trading opportunity reports, core watchlist, high-potential watchlist, market briefs, market outlook, and investment academy. Seven integrated modules covering everything from macro analysis to precise entry execution — a complete trading loop.
订阅会员可获得完整访问权限,包括:
Subscribing members receive full access to:
交易机会报告
深度研究报告
潜力名单
核心名单
25 套专业交易系统完整使用权
Trading opportunity reports
Deep research reports
Potential watchlist
Core watchlist
Full access to all 25 professional trading systems
主图系统 Main Chart Systems
QuantFlow Trading System · 量化趋势交易系统 【主图】【Main Chart】
Apex Pro Trading System · 巅峰交易系统 【主图】【Main Chart】
Apex Trading System · 顶点交易系统 【主图】【Main Chart】
Confluence Trading System · 共振交易系统 【主图】【Main Chart】
Confluence Pro Trading System · 共振进阶交易系统 【主图】【Main Chart】
Pivot Trading System · 高低点捕捉交易系统 【主图】【Main Chart】
Momentum Dynamic Trading System · 动能交易系统 【主图】【Main Chart】
Alpha Quantitative Trading System · Alpha量化交易系统 【主图】【Main Chart】
Cycle Trading System · 周期转折交易系统 【主图】【Main Chart】
Reversal Pro Trading System · 反转捕捉进阶交易系统 【主图】【Main Chart】
Top & Bottom Trading System · 逃顶抄底交易系统 【主图】【Main Chart】
Auto Support & Resistance Trading System · 智能支撑压力交易系统 【主图】【Main Chart】
副图系统 Sub Chart Systems
Trail Trading System · 轨迹信号交易系统 【副图】【Sub Chart】
Dot Trading System · 点位信号交易系统 【副图】【Sub Chart】
Rainbow Trading System · 彩虹趋势交易系统 【副图】【Sub Chart】
Force Trading System · 多空动能交易系统 【副图】【Sub Chart】
Radar Trading System · 雷达交易系统 【副图】【Sub Chart】
Flow Trading System · 顺势交易系统 【副图】【Sub Chart】
Duel Trading System · 多空对决交易系统 【副图】【Sub Chart】
Zone Trading System · 热度预警交易系统 【副图】【Sub Chart】
Sigma Trading System · 顶底捕捉交易系统 【副图】【Sub Chart】
Reversal Trading System · 反转捕捉交易系统 【副图】【Sub Chart】
Top & Bottom Hunter Trading System · 顶底猎手交易系统 【副图】【Sub Chart】
Smart Money Hunter Trading System · 主力猎手交易系统 【副图】【Sub Chart】
部分标的自入选以来已录得超过+700%回报。
Some selections have returned over +700% since inclusion.
我们的价格
Our Pricing
月费:$68每月
Monthly plan: $68/month
年费:$38每月 · $456每年(较月费节省44%)
Annual plan: $38/month · $456/year (save 44% versus monthly)
以年费计算,每天实际成本仅$1.25。平均每套系统每天不到5美分。
On the annual plan, your actual daily cost is just $1.25. That works out to less than 5 cents per system per day.
为什么选择 Wealth Club?
Why Wealth Club?
以下数据来自市场同类产品的公开定价,对比之下,Wealth Club 的会员方案是市面上性价比最高的选择之一。
The following figures are based on publicly available pricing for comparable market products. By comparison, Wealth Club membership represents one of the best-value propositions available today.
市场上,一套专业交易指标的订阅费用通常约为$98至$168美元每月。而Wealth Club为你提供的,不只是25套不同功能的专业交易系统,更是一个覆盖从宏观研判到精准入场的完整交易生态系统。
A single professional trading indicator typically costs between $98 and $168 per month on the open market. What Wealth Club offers is not just 25 professional trading systems with different functions — it is a complete trading ecosystem covering everything from macro analysis to precise entry execution.
市场价值对比
Market Value Comparison
25套量化交易信号系统 × 市场均价$98至$168每月 = $2,450至$4,200每月
25 quantitative trading systems × market rate $98–$168/month = $2,450–$4,200/month
研究报告与交易机会报告 ≈ $500每月
Research reports and trading opportunity reports ≈ $500/month
市场总价值 ≈ $2,950至$4,700每月
Total market value ≈ $2,950–$4,700/month
现在就是时候 | The Time Is Now
大多数人等待”完美时机”入场——但完美时机永远不会来。真正的机会,从来只属于提前布局的人。市场不等人。现在加入的人,看到的永远比后来者多一步。
Most people wait for the “perfect moment” to act — but that moment never arrives. Real opportunity has always belonged to those who position ahead of it. The market does not wait. Those who act now will always be one step ahead.
🎁 早鸟限时优惠 · 月费:$68每月 — 优惠期结束后恢复原价每月$88。
🎁 早鸟限时优惠 · 年费:$38每月 · $456每年 — 优惠期结束后恢复原价每月$58 · $696每年。
🎁 Early Bird Special · Monthly plan: $68/month — Price will return to $88/month after the promotional period ends.
🎁 Early Bird Special · Annual plan: $38/month · $456/year — Price will return to $58/month · $696/year after the promotional period ends.
Subscribe now and lock in your early bird rate.
你获得的,是市价$2,950至$4,700每月的完整交易生态系统。你支付的,是$456每年。这还不包括我们的会员已在交易机会名单上录得+100%至+700%回报的实际价值。所有操作记录均已公开于会员平台,供会员随时核对对照。
What you receive is a complete trading ecosystem worth $2,950 to $4,700 per month on the open market. What you pay is $456 per year. And that figure does not even account for the +100% to +700% returns our members have already achieved from the Trading Ideas watchlist. All trade records are published openly on the member platform, available for members to verify and cross-reference at any time.
这不只是一个订阅,而是一个持续成长的平台。团队将持续因应市场变化、科技发展及交易研究的最新成果,不断添加更多增值内容。与此同时,现有的交易系统将持续整合AI与机器学习技术,不断强化信号精准度与市场适应能力。团队也会持续研发全新的交易系统,所有新系统上线后,现有会员均可同步免费使用。
This is not simply a subscription — it is a platform that grows with you. The team will continuously add new value-added content in response to market developments, technological advancements, and the latest research. At the same time, existing trading systems will be continuously enhanced through the integration of AI and machine learning, improving signal precision and adaptability across different market conditions. The team is also actively developing new trading systems — and as each one launches, all existing members will have free access automatically.
我们已经见证了许多会员从零开始,逐步摸索出一套真正适合自己的交易战法,并在市场中取得了属于自己的成果。不少会员在我们的核心名单与交易机会标的上取得了+100%至+700%以上的成绩。希望接下来,我们能见证更多会员的成长故事。
We have already seen many members start from scratch, gradually develop a trading approach that truly suits them, and achieve results of their own in the market. A number of members have achieved gains of +100% to +300% and beyond on positions from our Core Watchlist and Trading Ideas. We look forward to witnessing many more member success stories in the chapters ahead.
每一位今天加入的会员,都将是这一切成长的受益者。市场不等人,系统越早用越熟,优势越早建立。你开始的那一天,就是你与其他散户拉开距离的那一天。
Every member who joins today will be among the first to benefit from everything that comes next. The market does not wait. The earlier you build your system, the earlier you build your edge. The day you start is the day you begin pulling ahead.
周期转折交易系统 · Cycle Trading System
精准识别市场周期转折点,提前布局每一次趋势切换。
👉 查看完整使用指南:https://www.thewealthclub.vip/trading-system-cycle-trading-system/
Precisely identifies market cycle turning points, positioning you ahead of every trend shift.
👉 View Full Usage Guide: https://www.thewealthclub.vip/trading-system-cycle-trading-system/
动能交易系统 · Momentum Dynamic Trading System
【主图 · Main Chart】
实时监测市场动能积累与释放,在趋势爆发前率先捕捉动能信号,让你永远比市场早一步行动。
Monitors market momentum buildup and release in real time — capturing momentum signals before the trend explodes, so you always act one step ahead of the market.
趋势不会突然出现。在它爆发之前,动能已经在积累了。
Trends don't appear suddenly. Before they explode, momentum has already been building.
大多数人错过最好的买点,不是因为反应慢,而是因为他们看不见动能正在积累的过程。等到价格大涨,人人都看见了,最好的入场时机已经过去。Momentum Dynamic Trading System · 动能交易系统由财富俱乐部量化分析团队打造,专门解决这一个问题——在动能积累阶段,提前告诉你趋势的方向和力度。
Most people miss the best entry points not because they react slowly, but because they can't see momentum building. By the time prices surge and everyone notices, the best entry opportunity has already passed. The Momentum Dynamic Trading System · 动能交易系统, built by the Wealth Club quantitative analysis team, is designed to solve exactly this — to tell you the direction and strength of a trend during the momentum accumulation phase, before it's obvious.
无需成为图表专家,强大的算法自动为你绘制所有关键信息。适用于股票、加密货币、外汇和商品等任何金融市场,支持1m、5m、15m、1h、4H、1D等所有主流时间框架。无论你是日内交易者、波段交易者还是趋势交易者,Momentum Dynamic都能为你更清晰地展示市场动能方向,让你像机构一样进行交易。
No need to be a chart expert. Our powerful algorithm automatically plots all key information for you. Compatible with any financial market — stocks, crypto, forex, and commodities — across all major timeframes including 1m, 5m, 15m, 1h, 4H, and 1D. Whether you're a day trader, swing trader, or trend trader, Momentum Dynamic gives you a clearer view of market momentum so you can trade like an institution.
这套系统做了什么?
What does this system do?
财富俱乐部量化分析团队通过以下四个维度构建这套系统:
深度量化研究公司财务数据
K线与趋势技术指标分析
机构主力资金流向监测
大数据与AI驱动的多因子模型
The Wealth Club quantitative analysis team built this system across four dimensions:
In-depth quantitative research of company financial data
Candlestick and trend technical indicator analysis
Institutional capital flow monitoring
Big data and AI-driven multi-factor model
在上述四个维度的基础上,Momentum Dynamic系统额外整合了动能积累速率评分(Momentum Accumulation Rate Score)与量价背离预警模型(Volume-Price Divergence Alert)。前者是对冲基金量化团队广泛使用的动能因子衍生指标,用于衡量动能在单位时间内的累积速度——速率越快,代表趋势爆发越近;后者则实时侦测价格与成交量之间的背离关系,当价格上涨但成交量萎缩时,系统会在趋势逆转前发出预警。
In addition to the four core dimensions, the Momentum Dynamic system further integrates a Momentum Accumulation Rate Score and a Volume-Price Divergence Alert Model. The former is a momentum factor derivative widely used by hedge fund quantitative teams, measuring the speed at which momentum builds over time — the faster the rate, the closer the breakout. The latter detects divergence between price and volume in real time; when price rises but volume contracts, the system issues a warning before the trend reverses.
当四个维度的量化数据同时形成向上共振,Momentum Dynamic交易系统会在图表上呈现明确的信号。你不需要理解背后的模型,不需要计算任何数字。量化通道的颜色变化,已经把四个维度的综合结论直接告诉你。
When the quantitative data across all four dimensions simultaneously forms a resonance signal, the Momentum Dynamic trading system presents a clear signal on your chart. You don't need to understand the underlying model or calculate any numbers. The color change of the quantitative channel already delivers the combined conclusion of all four dimensions directly to you.
最终呈现在你面前的,只有两件事:图表上的Buy,和图表上的Sell。
What's presented to you is simple: Buy on the chart, and Sell on the chart.
🟢 绿色通道 → 上升趋势,买入机会
🟢 Green channel → Uptrend, buy opportunity
🟣 紫红色通道 → 趋势反转,卖出机会
🟣 Magenta channel → Trend reversal, sell opportunity
掌握了这套交易系统的完整用法,你已经拥有了多数散户看不见的信息优势。通道的颜色、信号的层次、动能极值的预警,同时运作,让你在每一个关键时刻都有据可依。把这套系统加进你的图表,从今天开始跟随量化的节奏——在机会出现之前更早发现潜在入场时机,在价格处于高位时更早收到风险提示,将复杂的市场信号转化为清晰可见的视觉语言。不再靠感觉做决定。让数据替你读懂市场。
Once you master the complete usage of this system, you gain an informational edge that most retail traders simply cannot see. The channel colors, signal layers, and momentum extreme alerts all work together — so at every critical moment, you have a clear basis for your decision. Add this system to your chart and start following the quantitative rhythm today — spot potential entry opportunities earlier, receive risk alerts before prices peak, and turn complex market signals into clear visual language. No more decisions based on gut feeling. Let the data read the market for you.
订阅后即可解锁Momentum Dynamic完整使用指南,包括:
Subscribe to unlock the complete Momentum Dynamic usage guide, including:
通道转绿时的具体入场操作,通道转紫时的具体离场操作
Exactly how to enter when the channel turns green and how to exit when it turns purple
哪个时间周期效果最好,日线、周线、小时线各有什么不同用法
Which timeframe works best — how daily, weekly, and hourly charts each serve a different purpose
如何判断通道颜色刚转变时的强弱,强信号和弱信号操作方式完全不同
How to judge signal strength when the channel color first changes — strong and weak signals require completely different approaches
如何配合支撑位、压力位及副图系统使用,形成更高胜率的交易系统
How to combine with support and resistance levels and sub-chart systems to build a higher win-rate trading system
如何在TradingView上获得这个指标的专属授权,直接在你自己的账户上实时使用
How to obtain exclusive TradingView access to run this indicator live in your own account
25 套量化交易信号系统 · 完整交易生态系统
25 Quantitative Trading Signal Systems · A Complete Trading Ecosystem
交易系统均基于AI机器学习量化模型持续优化,系统数量将随优化进程动态调整。
All trading systems are continuously optimized through AI-driven machine learning and quantitative modelling. The number of systems is subject to change as optimization evolves.
我们提供的,从来不只是一套买卖信号工具。
What we offer has never been just a set of buy and sell signals.
Wealth Club 构建的是一个完整的交易生态系统——25 套量化买卖信号交易系统、深度研究报告、交易机会报告、核心持仓名单、高潜力名单、市场简报、市场前瞻与投资学堂,七大模块有机结合,覆盖从宏观研判到精准入场的完整交易闭环。
Wealth Club is built around a complete trading ecosystem — 25 quantitative signal trading systems, deep research reports, trading opportunity reports, core watchlist, high-potential watchlist, market briefs, market outlook, and investment academy. Seven integrated modules covering everything from macro analysis to precise entry execution — a complete trading loop.
订阅会员可获得完整访问权限,包括:
Subscribing members receive full access to:
交易机会报告
深度研究报告
潜力名单
核心名单
25 套专业交易系统完整使用权
Trading opportunity reports
Deep research reports
Potential watchlist
Core watchlist
Full access to all 25 professional trading systems
👉 查看完整使用指南:https://www.thewealthclub.vip/trading-system-momentum/
👉 View Full Usage Guide: https://www.thewealthclub.vip/trading-system-momentum/
反转捕捉进阶交易系统 · Reversal Pro Trading System
【主图 · Main Chart】
精准捕捉市场顶底反转信号,在趋势切换的关键时刻提前入场。
Precisely captures market top and bottom reversal signals, positioning you at the critical moment of every trend shift.
当大多数人还在下跌里害怕、在上涨里犹豫,Reversal Pro Trading System已经开始帮你识别市场真正的转折区域。
While most traders are still afraid during declines and hesitant during rebounds, the Reversal Pro Trading System is already helping you identify where the market is actually beginning to turn.
市场里最难赚的一段,往往不是趋势中间,而是趋势刚刚反过来的那一段。多数散户在这里要么跌深后不敢买,要么在反弹初期不相信,等真正涨起来后才开始追。结果不是错过最好的成本,就是在反转已经走完一段后接在更高的位置。
The most valuable part of the market is often not the middle of a trend, but the exact stretch where the trend begins to reverse. Most retail traders either become too afraid to buy after a decline, or do not believe the rebound early enough and only chase after the move is already well underway.
Reversal Pro Trading System · 反转捕捉交易系统由财富俱乐部量化分析团队打造,核心目标不是让你追逐已经走出来的趋势,而是帮助你更早识别"下跌结束、修复开始、反转形成"这一整段结构变化。
Built by the Wealth Club quantitative analysis team, the Reversal Pro Trading System · 反转捕捉交易系统 is not designed to help you chase trends that are already obvious. Its purpose is to help you identify earlier when a decline is ending, a repair phase is beginning, and a real reversal structure is starting to form.
这套系统做了什么?
What does this system do?
财富俱乐部量化分析团队通过以下四个维度构建这套系统:
下跌衰竭与反转节奏识别
多周期动能修复与结构切换监测
关键高低点与拐点确认
反转突破与失败反转筛选
The Wealth Club quantitative analysis team built this system across four dimensions:
Downside exhaustion and reversal-rhythm recognition
Multi-timeframe momentum repair and structure-switch monitoring
Key pivot and turning-point confirmation
Reversal breakout and failed-reversal filtering
在上述四个维度的基础上,Reversal Pro系统额外整合了动能修复速率算法(Momentum Repair Rate Algorithm)与结构切换置信度评分(Structure Switch Confidence Score)。前者通过量化动能从衰竭到修复的速率变化,精确识别反转的早期迹象;后者则对每一次结构切换进行多维度置信度评分,只有当评分超过临界值时,系统才会输出信号,从根本上过滤掉低质量的假反转信号。
In addition to the four core dimensions, the Reversal Pro system further integrates a Momentum Repair Rate Algorithm and a Structure Switch Confidence Score. The former quantifies the rate of change from momentum exhaustion to repair, precisely identifying early signs of reversal. The latter applies a multi-dimensional confidence score to every structural switch, only outputting a signal when the score exceeds a critical threshold, fundamentally filtering out low-quality false reversal signals.
系统将动能修复状态、结构切换方向、关键拐点位置以及节奏极值预警,全部实时整合在主图之中,让你在反转真正发生之前就做好准备。
The system integrates momentum repair status, structural shift direction, key pivot locations, and rhythm extreme alerts in real time directly on the main chart — so you are prepared before the reversal actually occurs.
最终呈现在你面前的,只有几件真正重要的事:反转是否开始、修复是否持续、关键拐点是否成立,以及图表上的Buy / Sell。
What ultimately appears in front of you is simple: whether the reversal is beginning, whether the repair is sustaining, whether the pivot is valid, and Buy / Sell directly on the chart.
🟢 绿色 → 反转修复,买入机会
🟢 Green → Reversal repairing, buy opportunity
🩷 粉红色 → 反弹衰减,卖出机会
🩷 Pink → Rebound fading, sell opportunity
无需成为图表专家,强大的算法自动为你绘制所有关键信息。适用于股票、加密货币、外汇和商品等任何金融市场,支持1m、5m、15m、1h、4H、1D等所有主流时间框架。无论你是日内交易者、波段交易者还是趋势交易者,Reversal Pro Trading System都能为你更清晰地展示市场方向,让你像机构一样进行交易。
No need to be a chart expert. Our powerful algorithm automatically plots all key information for you. Compatible with any financial market — stocks, crypto, forex, and commodities — across all major timeframes including 1m, 5m, 15m, 1h, 4H, and 1D. Whether you're a day trader, swing trader, or trend trader, the Reversal Pro Trading System gives you a clearer view of market direction so you can trade like an institution.
当MFI动能通道刚由粉红转绿,你知道这只是下跌中的一次小修复,还是反转真正开始了吗?当Buy出现在SRB基准线下方,它和出现在基准线上方,含义完全一样吗?当"9"字出现在一轮下跌末端,那是开始观察反转的区域,还是仅仅提醒你不要盲目抄底?当Breakout出现,它是反转确认,还是只是一次情绪拉升?每一个问题,都是散户长期追涨杀跌、乱做交易的根源。完整使用指南在下方——让你从今天开始,用系统代替感觉,用纪律代替冲动,每一笔交易都有据可依。
When the MFI Momentum Channel has just turned from pink to green, do you know whether this is only a small repair or the beginning of a true reversal? When a Buy appears below the SRB Baseline, does it mean the same thing as a Buy above it? When a "9" appears near the end of a decline, is it a reversal observation zone or simply a warning not to bottom-fish blindly? When Breakout appears, does it confirm reversal structure or only reflect emotional buying? Every one of these questions is the root cause of why retail traders keep chasing rallies and panic-selling. The complete usage guide is below — so from today, you trade with a system instead of instinct, with discipline instead of impulse, with a clear reason behind every single trade.
订阅后即可解锁Reversal Pro Trading System完整使用指南,包括:
Subscribe to unlock the complete Reversal Pro Trading System usage guide, including:
具体怎么用这套系统进行反转买卖决策,包括信号出现后应该如何配合仓位管理
Exactly how to use this system for reversal buy and sell decisions, including position sizing after a signal appears
哪个时间周期效果最好,日线、周线、小时线各有什么不同用法
Which timeframe works best — how daily, weekly, and hourly charts each serve a different purpose
如何避免假反转信号,什么情况下Buy信号应该忽略
How to avoid false reversal signals and when a Buy signal should be ignored
"9"字提醒在反转结构里分别意味着什么,什么时候只是提醒,什么时候价值更高
What the "9" marker means inside a reversal structure, and when it matters more
Breakout提示什么时候代表反转确认,什么时候只是短线冲高
When a Breakout label confirms reversal structure and when it is only a short-term spike
如何配合支撑位、压力位及其他系统使用,形成更高胜率的交易系统
How to combine with support and resistance levels and other systems to build a higher win-rate trading system
如何在TradingView上获得这个指标的专属授权
How to obtain exclusive TradingView access to run this indicator live in your own account
25套量化交易信号系统 · 完整交易生态系统
25 Quantitative Trading Signal Systems · A Complete Trading Ecosystem
交易系统均基于AI机器学习量化模型持续优化,系统数量将随优化进程动态调整。
All trading systems are continuously optimized through AI-driven machine learning and quantitative modelling. The number of systems is subject to change as optimization evolves.
我们提供的,从来不只是一套买卖信号工具。
What we offer has never been just a set of buy and sell signals.
Wealth Club 构建的是一个完整的交易生态系统——25套量化买卖信号交易系统、深度研究报告、交易机会报告、核心持仓名单、高潜力名单、市场简报、市场前瞻与投资学堂,七大模块有机结合,覆盖从宏观研判到精准入场的完整交易闭环。
Wealth Club is built around a complete trading ecosystem — 25 quantitative signal trading systems, deep research reports, trading opportunity reports, core watchlist, high-potential watchlist, market briefs, market outlook, and investment academy. Seven integrated modules covering everything from macro analysis to precise entry execution — a complete trading loop.
订阅会员可获得完整访问权限,包括:
Subscribing members receive full access to:
交易机会报告
深度研究报告
潜力名单
核心名单
25套专业交易系统完整使用权
Trading opportunity reports
Deep research reports
Potential watchlist
Core watchlist
Full access to all 25 professional trading systems
👉 查看完整使用指南:https://www.thewealthclub.vip/reversal-pro-trading-system/
👉 View Full Usage Guide: https://www.thewealthclub.vip/reversal-pro-trading-system/

顶底猎手交易系统 · Top & Bottom Hunter Trading System
【主图 · Main Chart】
狙击市场最高点与最低点,精准定位每一次顶底转折机会。
Snipes market highs and lows with precision, pinpointing every top and bottom reversal opportunity.
市场最贵的两个位置,一个是顶,一个是底。能提前看见它们的人,赚的是最轻松的钱。
The two most valuable positions in the market are the top and the bottom. Those who can see them in advance make the easiest money.
散户最常犯的错误有两个:在顶部追进去,在底部割出来。不是因为他们不懂道理,而是因为在关键时刻,他们没有一个客观的系统告诉他们——这里,就是转折点。
The two most common mistakes retail traders make are buying at the top and selling at the bottom. Not because they don't understand the theory, but because at critical moments, they don't have an objective system telling them — this is the turning point.
Tops & Bottoms Hunter Trading System · 顶底猎手交易系统由财富俱乐部量化分析团队打造,专门解决这一个问题。但它与市场上其他同类系统有一个根本的差异——趋势方向直接写在K线颜色上。上升趋势,K线全部显示绿色;下降趋势,K线全部显示红色。不需要看均线,不需要判断方向,打开图表的第一秒,趋势已经一目了然。
The Tops & Bottoms Hunter Trading System · 顶底猎手交易系统 is built by the Wealth Club quantitative analysis team to solve exactly this problem. But it has one fundamental difference from other systems on the market — the trend direction is written directly into the colour of every candle. In an uptrend, every candle displays green. In a downtrend, every candle displays red. No need to read moving averages, no need to judge direction — the moment you open the chart, the trend is immediately visible.
买入和卖出的信号直接出现在K线图上,蓝色Buy标签标在关键低点,粉色Sell标签标在关键高点。当价格出现放量突破时,系统同步发出Breakout突破信号。三个信号层次清晰,各司其职,共同构成一套完整的顶底捕捉框架。
Buy and Sell signals appear directly on the candlestick chart. A blue Buy label marks key low points, and a pink Sell label marks key high points. When price breaks out on elevated volume, the system simultaneously issues a Breakout signal. Three layers of signals, each with a distinct role, forming a complete framework for capturing market tops and bottoms.
无需成为图表专家,强大的算法自动为你绘制所有关键信息。适用于股票、加密货币、外汇和商品等任何金融市场,支持1m、5m、15m、1h、4H、1D等所有主流时间框架。无论你是日内交易者、波段交易者还是趋势交易者,Tops & Bottoms Hunter都能为你精准定位市场的关键转折点,让你像机构一样进行交易。
No need to be a chart expert. The powerful algorithm automatically plots all key information for you. Compatible with any financial market — stocks, crypto, forex, and commodities — across all major timeframes including 1m, 5m, 15m, 1h, 4H, and 1D. Whether you are a day trader, swing trader, or trend trader, Tops & Bottoms Hunter precisely identifies the market's critical turning points so you can trade like an institution.
这套系统做了什么?
What does this system do?
财富俱乐部量化分析团队通过以下四个维度构建这套系统:
深度量化研究公司财务数据
K线与趋势技术指标分析
机构主力资金流向监测
大数据与AI驱动的多因子模型
The Wealth Club quantitative analysis team built this system across four dimensions:
In-depth quantitative research of company financial data
Candlestick and trend technical indicator analysis
Institutional capital flow monitoring
Big data and AI-driven multi-factor model
在上述四个维度的基础上,Tops & Bottoms Hunter系统额外整合了多周期枢轴共振强度模型(Multi-Timeframe Pivot Resonance Intensity Model)与动态趋势状态分级引擎(Dynamic Trend State Classification Engine)。前者源自机构量化策略中用于过滤低质量信号的核心方法,通过日线、周线、月线多周期枢轴数据的叠加验证,只有当多个周期同时形成共振时,系统才输出Buy或Sell信号;后者则实时评估当前趋势所处的生命周期阶段,并将结果直接映射至K线颜色——绿色代表趋势健康向上,红色代表趋势已转向下行,颜色切换即是趋势转折的实时提示。
In addition to the four core dimensions, the Tops & Bottoms Hunter system further integrates a Multi-Timeframe Pivot Resonance Intensity Model and a Dynamic Trend State Classification Engine. The former is derived from a core methodology used in institutional quantitative strategies to filter low-quality signals — through layered verification of daily, weekly, and monthly pivot data across multiple timeframes, the system only outputs a Buy or Sell signal when multiple timeframes simultaneously form a resonance. The latter continuously assesses the lifecycle stage of the current trend and maps the result directly onto candle colour — green represents a healthy upward trend, red indicates the trend has turned downward, and a colour shift serves as a real-time alert of a trend reversal.
K线颜色随趋势实时动态变化,是这套系统最直观的核心设计。上升趋势中全部K线显示绿色,下降趋势中全部K线显示红色,趋势转折时颜色同步切换。不需要判断,不需要解读,趋势方向在视觉上已经完全呈现。Buy和Sell标签直接标注在K线图的关键高低点上,配合Breakout突破信号,构成三个层次清晰的操作参考。每一个信号的触发,都经过多个条件的同时验证。
Candle colour changes dynamically with the trend in real time — this is the most intuitive core design of this system. In an uptrend every candle is green, in a downtrend every candle is red, and the colour shifts simultaneously with any trend reversal. No interpretation needed. The trend direction is fully expressed through what you see. Buy and Sell labels are marked directly at key highs and lows on the candlestick chart, complemented by the Breakout signal, forming three layers of clear and actionable references. Every signal is triggered only after multiple conditions are simultaneously verified.
最终呈现在你面前的,只有三件事:
What is ultimately presented to you is just three things:
K线的颜色
The colour of the candles
图表上的Buy
Buy on the chart
图表上的Sell
Sell on the chart
订阅后即可解锁Tops & Bottoms Hunter完整使用指南,包括:
Subscribe to unlock the complete Tops & Bottoms Hunter usage guide, including:
Buy信号出现后应该如何进场,Sell信号出现后应该如何阶段性锁利,什么情况下信号可信度最高
How to enter after a Buy signal appears, how to take staged profits after a Sell signal appears, and when signal reliability is highest
Breakout突破信号出现时应该如何配合Buy与Sell信号操作
How to use the Breakout signal in conjunction with Buy and Sell signals
哪个时间周期效果最好,日线、周线、小时线各有什么不同用法
Which timeframe works best — how daily, weekly, and hourly charts each serve a different purpose
如何避免假突破,什么情况下Buy信号应该忽略
How to avoid false breakouts and when a Buy signal should be ignored
如何配合支撑位、压力位及副图系统使用,形成更高胜率的交易系统
How to combine with support and resistance levels and sub-chart systems to build a higher win-rate trading approach
如何在TradingView上获得这个指标的专属授权,直接在你自己的账户上实时使用
How to obtain exclusive TradingView access to run this indicator live in your own account
25套量化交易信号系统 · 完整交易生态系统
25 Quantitative Trading Signal Systems · A Complete Trading Ecosystem
交易系统均基于AI机器学习量化模型持续优化,系统数量将随优化进程动态调整。
All trading systems are continuously optimized through AI-driven machine learning and quantitative modelling. The number of systems is subject to change as optimization evolves.
我们提供的,从来不只是一套买卖信号工具。
What we offer has never been just a set of buy and sell signals.
Wealth Club 构建的是一个完整的交易生态系统——25 套量化买卖信号交易系统、深度研究报告、交易机会报告、核心持仓名单、高潜力名单、市场简报、市场前瞻与投资学堂,七大模块有机结合,覆盖从宏观研判到精准入场的完整交易闭环。
Wealth Club is built around a complete trading ecosystem — 25 quantitative signal trading systems, deep research reports, trading opportunity reports, core watchlist, high-potential watchlist, market briefs, market outlook, and investment academy. Seven integrated modules covering everything from macro analysis to precise entry execution — a complete trading loop.
订阅会员可获得完整访问权限,包括:
Subscribing members receive full access to:
交易机会报告
深度研究报告
潜力名单
核心名单
25套专业交易系统完整使用权
Trading opportunity reports
Deep research reports
Potential watchlist
Core watchlist
Full access to all 25 professional trading systems
👉 查看完整使用指南:https://www.thewealthclub.vip/trading-system-3/
👉 View Full Usage Guide: https://www.thewealthclub.vip/trading-system-3/
量化趋势交易系统 · QuantFlow Trading System
【主图 · Main Chart】
多维度量化模型实时追踪趋势方向与强度,让每一次趋势行情都清晰呈现在K线图上。
Multi-dimensional quantitative model tracks trend direction and strength in real time, making every trending move crystal clear directly on your chart.
市场每天都在运动,但真正值得参与的机会,永远只在趋势明确的那一刻。
Markets move every day — but the opportunities truly worth acting on only appear at the moment a trend becomes clear.
大多数人错过最好的买点,不是因为反应慢,而是因为他们无法在噪音中识别真正的趋势转变。等到方向人人都看见了,最好的入场时机已经过去。QuantFlow Trading System · 量化趋势交易系统由财富俱乐部量化分析团队打造,专门解决这一个问题——通过多维度量化模型,提前捕捉趋势的启动与终结,让你在关键转折点做出清晰决定。
Most people miss the best entry points not because they react slowly, but because they can't identify genuine trend shifts through the noise. By the time the direction is obvious to everyone, the best opportunity has already passed. The QuantFlow Trading System · 量化趋势交易系统, built by the Wealth Club quantitative analysis team, is designed to solve exactly this — using a multi-dimensional quantitative model to capture the start and end of trends early, giving you clarity at every critical turning point.
无需成为图表专家,强大的算法自动为你绘制所有关键信息。适用于股票、加密货币、外汇和商品等任何金融市场,支持1m、5m、15m、1h、4H、1D等所有主流时间框架。无论你是日内交易者、波段交易者还是趋势交易者,QuantFlow都能为你更清晰地展示市场动能方向,让你像机构一样进行交易。
No need to be a chart expert. Our powerful algorithm automatically plots all key information for you. Compatible with any financial market — stocks, crypto, forex, and commodities — across all major timeframes including 1m, 5m, 15m, 1h, 4H, and 1D. Whether you're a day trader, swing trader, or trend trader, QuantFlow gives you a clearer view of market direction so you can trade like an institution.
这套系统做了什么?
What does this system do?
财富俱乐部量化分析团队通过以下四个维度构建这套系统:
深度量化研究公司财务数据
K线与趋势技术指标分析
机构主力资金流向监测
大数据与AI驱动的多因子模型
The Wealth Club quantitative analysis team built this system across four dimensions:
In-depth quantitative research of company financial data
Candlestick and trend technical indicator analysis
Institutional capital flow monitoring
Big data and AI-driven multi-factor model
在上述四个维度的基础上,QuantFlow系统额外整合了两套专有量化模型。第一套模型持续追踪多周期市场结构的方向共振,当短中长期趋势同时指向同一方向时,系统自动识别高概率的转折窗口。第二套模型实时监测市场动能的极值状态,在价格动能出现过热或过冷的临界点时,系统率先发出预警,帮助你在最关键的位置提前做好准备。两套模型协同运作,使QuantFlow系统能够同时告诉你趋势的方向、动能的强弱,以及风险的积累程度——三个维度的信息,全部以颜色和信号的方式直观呈现在图表上。
In addition to the four core dimensions, the QuantFlow system further integrates two proprietary quantitative models. The first continuously tracks directional resonance across multiple market structure timeframes — when short, medium, and long-term trends simultaneously align in the same direction, the system automatically identifies high-probability turning windows. The second monitors momentum extremes in real time, issuing early alerts when price momentum approaches critical overheating or oversold thresholds — so you can prepare at the most important positions before the move unfolds. The two models operate in concert, enabling the QuantFlow system to simultaneously convey trend direction, momentum strength, and risk accumulation level — all three dimensions presented intuitively through colors and signals directly on your chart.
当量化数据同时形成向上共振,QuantFlow交易系统会在图表上呈现明确的信号——量化通道转为绿色,代表趋势进入上升通道、动能强劲,系统自动标出蓝色Buy信号。
When quantitative data simultaneously forms an upward resonance, the QuantFlow trading system presents a clear signal on your chart — the quantitative channel turns green, indicating the trend has entered an upward channel with strong momentum, and the system automatically marks a blue Buy signal.
相反,当量化数据同时形成向下共振,量化通道转为紫色,代表趋势反转向下、动能转弱,系统自动标出粉红色Sell信号。
Conversely, when quantitative data simultaneously forms a downward resonance, the channel turns purple, signaling that the trend has reversed downward with weakening momentum, and the system automatically marks a pink Sell signal.
你不需要理解背后的模型,不需要计算任何数字。量化通道的颜色变化,已经把所有维度的综合结论直接告诉你。
You don't need to understand the underlying model or calculate any numbers. The color change of the quantitative channel already delivers the combined conclusion of all dimensions directly to you.
最终呈现在你面前的,只有两件事:图表上的Buy,和图表上的Sell。
What's presented to you is simple: Buy on the chart, and Sell on the chart.
🟢 绿色通道 → 上升趋势,买入机会
🟢 Green channel → Uptrend, buy opportunity
🟣 紫红色通道 → 趋势反转,卖出机会
🟣 Magenta channel → Trend reversal, sell opportunity
订阅后即可解锁QuantFlow完整使用指南,包括:
Subscribe to unlock the complete QuantFlow usage guide, including:
通道转绿时的具体入场操作,通道转紫时的具体离场操作
Exactly how to enter when the channel turns green and how to exit when it turns purple
哪个时间周期效果最好,日线、周线、小时线各有什么不同用法
Which timeframe works best — how daily, weekly, and hourly charts each serve a different purpose
如何判断通道颜色刚转变时的强弱,强信号和弱信号操作方式完全不同
How to judge signal strength when the channel color first changes — strong and weak signals require completely different approaches
四种信号各自代表什么,应该如何配合使用
What each of the four signals means and how to use them together
如何配合支撑位、压力位及副图系统使用,形成更高胜率的交易系统
How to combine with support and resistance levels and sub-chart systems to build a higher win-rate trading system
如何在TradingView上获得这个指标的专属授权,直接在你自己的账户上实时使用
How to obtain exclusive TradingView access to run this indicator live in your own account
25套量化交易信号系统 · 完整交易生态系统
25 Quantitative Trading Signal Systems · A Complete Trading Ecosystem
交易系统均基于AI机器学习量化模型持续优化,系统数量将随优化进程动态调整。
All trading systems are continuously optimized through AI-driven machine learning and quantitative modelling. The number of systems is subject to change as optimization evolves.
我们提供的,从来不只是一套买卖信号工具。
What we offer has never been just a set of buy and sell signals.
Wealth Club 构建的是一个完整的交易生态系统——25套量化买卖信号交易系统、深度研究报告、交易机会报告、核心持仓名单、高潜力名单、市场简报、市场前瞻与投资学堂,七大模块有机结合,覆盖从宏观研判到精准入场的完整交易闭环。
Wealth Club is built around a complete trading ecosystem — 24 quantitative signal trading systems, deep research reports, trading opportunity reports, core watchlist, high-potential watchlist, market briefs, market outlook, and investment academy. Seven integrated modules covering everything from macro analysis to precise entry execution — a complete trading loop.
订阅会员可获得完整访问权限,包括:
Subscribing members receive full access to:
交易机会报告
深度研究报告
潜力名单
核心名单
25套专业交易系统完整使用权
Trading opportunity reports
Deep research reports
Potential watchlist
Core watchlist
Full access to all 25 professional trading systems
👉 查看完整使用指南:https://www.thewealthclub.vip/trading-system-quantflow/
👉 View Full Usage Guide: https://www.thewealthclub.vip/trading-system-quantflow/
量化交易系统 · Alpha Quantitative Trading System
【主图 · Main Chart】
以机构级量化逻辑捕捉超额收益机会,精准识别市场中具备Alpha潜力的最优入场时机。
Captures alpha-generating opportunities with institutional-grade quantitative logic, precisely identifying the optimal entry points with the highest return potential in the market.
当你还在猜测方向,Alpha已经帮你算好了。
While you're guessing the direction, Alpha has already calculated it for you.
大多数散户亏钱,不是因为不够努力,而是因为没有一套系统帮他们过滤噪音、识别真正的趋势。Alpha Quantitative Trading System · Alpha量化交易系统由财富俱乐部量化分析团队倾力打造,将复杂的多维度市场分析浓缩成图表上两条动态通道——让趋势方向一目了然,让买卖时机自动浮现。
Most retail traders lose money not because they don't work hard enough, but because they lack a system to filter out noise and identify real trends. The Alpha Quantitative Trading System · Alpha量化交易系统, developed by the Wealth Club quantitative analysis team, condenses complex multi-dimensional market analysis into two dynamic channels on your chart — making trend direction instantly clear and entry/exit signals appear automatically.
无需成为图表专家,强大的算法自动为你绘制所有关键信息。适用于股票、加密货币、外汇和商品等任何金融市场,支持1m、5m、15m、1h、4H、1D等所有主流时间框架。无论你是日内交易者、波段交易者还是趋势交易者,Alpha都能为你更清晰地展示市场方向,让你像机构一样进行交易。
No need to be a chart expert. Our powerful algorithm automatically plots all key information for you. Compatible with any financial market — stocks, crypto, forex, and commodities — across all major timeframes including 1m, 5m, 15m, 1h, 4H, and 1D. Whether you're a day trader, swing trader, or trend trader, Alpha gives you a clearer view of market direction so you can trade like an institution.
这套系统做了什么?
What does this system do?
财富俱乐部量化分析团队通过以下四个维度构建这套系统:
深度量化研究公司财务数据
K线与趋势技术指标分析
机构主力资金流向监测
大数据与AI驱动的多因子模型
The Wealth Club quantitative analysis team built this system across four dimensions:
In-depth quantitative research of company financial data
Candlestick and trend technical indicator analysis
Institutional capital flow monitoring
Big data and AI-driven multi-factor model
在上述四个维度的基础上,Alpha系统额外整合了趋势持续性因子(Trend Persistence Factor)与贝塔敞口动态监测(Dynamic Beta Exposure Tracking)。前者来源于机构量化研究中评估趋势生命周期的核心模型,用于判断当前趋势是处于初期、中期还是衰竭阶段;后者则实时追踪价格与大盘之间的相关性变化,当市场系统性风险上升时,系统会提前预警,帮助你在趋势终结前做出反应。
In addition to the four core dimensions, the Alpha system further integrates a Trend Persistence Factor and Dynamic Beta Exposure Tracking. The former is derived from institutional quantitative models used to assess trend lifecycle — identifying whether a trend is in its early, mid, or exhaustion phase. The latter monitors real-time changes in the correlation between price and the broader market; when systemic market risk rises, the system provides early warning before the trend ends.
Alpha在主图上同时显示两条动态量化通道,两条通道之间的填充区域直接告诉你当前的趋势格局。当小周期动能线运行在大周期基准线上方,两线之间填充绿色,代表趋势向上、上升通道成立;当小周期动能线跌破大周期基准线,填充转为深红色,代表趋势反转向下、下降通道成立。与此同时,小周期动能线本身的颜色也携带信息——绿色代表短期上涨动能,红色代表短期下跌动能。系统在关键高低点自动标出Buy和Sell信号。
Alpha displays two dynamic quantitative channels simultaneously on the main chart, with the fill zone between them telling you the current trend structure directly. When the small-cycle momentum line runs above the large-cycle baseline, the zone fills green — an uptrend channel is in place. When the small-cycle line drops below the baseline, the fill turns deep red — the trend has reversed downward. Simultaneously, the color of the small-cycle momentum line itself carries information — green indicates short-term bullish momentum, red indicates short-term bearish momentum. The system automatically marks Buy and Sell signals at key high and low points.
最终呈现在你面前的,只有两件事:图表上的Buy,和图表上的Sell。
What's presented to you is simple: Buy on the chart, and Sell on the chart.
🟢 绿色通道 → 上升趋势,买入机会
🟢 Green channel → Uptrend, buy opportunity
🔴 深红色通道 → 下降趋势,卖出机会
🔴 Deep red channel → Downtrend, sell opportunity
订阅后即可解锁Alpha完整使用指南,包括:
Subscribe to unlock the complete Alpha usage guide, including:
具体怎么用这个系统进行买卖决策,包括信号出现后应该如何配合仓位管理。
Exactly how to use this system for buy and sell decisions, including position sizing after a signal appears.
哪个时间周期效果最好,日线、周线、小时线各有什么不同用法。
Which timeframe works best — how daily, weekly, and hourly charts each serve a different purpose.
如何避免假突破和假跌破,什么情况下Buy信号应该忽略。
How to avoid false breakouts and false breakdowns, and when a Buy signal should be ignored.
如何配合Auto Support & Resistance Trading System · 智能支撑压力交易系统的支撑位与压力位,以及Sigma · 顶底捕捉交易系统或Zone · 热度预警交易系统共同确认,形成更高胜率的交易系统。
How to combine with the support and resistance levels from the Auto Support & Resistance Trading System · 智能支撑压力交易系统, and confirmation from the Sigma · Top & Bottom Detection Trading System or Zone · Heat Alert Trading System, to build a higher win-rate trading system.
如何在TradingView上获得这个指标的专属授权,直接在你自己的账户上实时使用。
How to obtain exclusive TradingView access to run this indicator live in your own account.
25 套量化交易信号系统 · 完整交易生态系统
25 Quantitative Trading Signal Systems · A Complete Trading Ecosystem
交易系统均基于AI机器学习量化模型持续优化,系统数量将随优化进程动态调整。
All trading systems are continuously optimized through AI-driven machine learning and quantitative modelling. The number of systems is subject to change as optimization evolves.
我们提供的,从来不只是一套买卖信号工具。
What we offer has never been just a set of buy and sell signals.
Wealth Club 构建的是一个完整的交易生态系统——25 套量化买卖信号交易系统、深度研究报告、交易机会报告、核心持仓名单、高潜力名单、市场简报、市场前瞻与投资学堂,七大模块有机结合,覆盖从宏观研判到精准入场的完整交易闭环。
Wealth Club is built around a complete trading ecosystem — 25 quantitative signal trading systems, deep research reports, trading opportunity reports, core watchlist, high-potential watchlist, market briefs, market outlook, and investment academy. Seven integrated modules covering everything from macro analysis to precise entry execution — a complete trading loop.
订阅会员可获得完整访问权限,包括:
Subscribing members receive full access to:
交易机会报告
深度研究报告
潜力名单
核心名单
25套专业交易系统完整使用权
Trading opportunity reports
Deep research reports
Potential watchlist
Core watchlist
Full access to all 25 professional trading systems
👉 查看完整使用指南:https://www.thewealthclub.vip/trading-system/
👉 View Full Usage Guide: https://www.thewealthclub.vip/trading-system/
共振交易系统 · Confluence Trading System
【主图 · Main Chart】
多重技术因子同步共振确认,只在最强信号对齐时发出交易指令,大幅提升交易胜率。
Multiple technical factors confirmed in simultaneous alignment, triggering signals only when the strongest confluences converge — significantly boosting your win rate.
一个信号可以是巧合。两个维度同时确认,就不是了。
One signal can be a coincidence. Two dimensions confirming simultaneously — that's not.
在交易里,最危险的事不是错过机会,而是在错误的信号上重仓进场。单一指标永远有盲点,单一周期永远有噪音。真正高胜率的交易,来自于多个维度同时指向同一个方向的那一刻。Confluence Trading System · 共振交易系统由财富俱乐部量化分析团队打造,专门捕捉这种多维度共振的关键时刻——把最高确信度的市场结构,直接呈现在你的图表上。
In trading, the most dangerous thing is not missing an opportunity — it's entering heavily on a wrong signal. A single indicator always has blind spots. A single timeframe always has noise. Truly high-probability trades come from the moment when multiple dimensions simultaneously point in the same direction. The Confluence Trading System · 共振交易系统, built by the Wealth Club quantitative analysis team, is designed to capture exactly these moments — presenting the highest-confidence market structure directly on your chart.
无需成为图表专家,强大的算法自动为你绘制所有关键信息。适用于股票、加密货币、外汇和商品等任何金融市场,支持1m、5m、15m、1h、4H、1D等所有主流时间框架。无论你是日内交易者、波段交易者还是趋势交易者,Confluence都能为你清晰呈现市场的结构状态,让你像机构一样进行交易。
No need to be a chart expert. Our powerful algorithm automatically plots all key information for you. Compatible with any financial market — stocks, crypto, forex, and commodities — across all major timeframes including 1m, 5m, 15m, 1h, 4H, and 1D. Whether you're a day trader, swing trader, or trend trader, Confluence gives you a clear picture of the market's structural state so you can trade like an institution.
这套系统做了什么?
What does this system do?
财富俱乐部量化分析团队通过以下四个维度构建这套系统:
深度量化研究公司财务数据
K线与趋势技术指标分析
机构主力资金流向监测
大数据与AI驱动的多因子模型
The Wealth Club quantitative analysis team built this system across four dimensions:
In-depth quantitative research of company financial data
Candlestick and trend technical indicator analysis
Institutional capital flow monitoring
Big data and AI-driven multi-factor model
在上述四个维度的基础上,Confluence系统额外整合了多时间框架共振度评分(Multi-Timeframe Confluence Score)与信号强度分级模型(Signal Conviction Grading)。前者是机构量化策略中用于过滤低质量信号的核心方法,通过日线、周线、月线多周期数据的叠加验证,只有当多个周期同时形成共振时,系统才输出信号;后者则将每一个信号按共振强度自动分为强、中、弱三个等级,帮助你根据信号质量精准调整仓位大小。
In addition to the four core dimensions, the Confluence system further integrates a Multi-Timeframe Confluence Score and a Signal Conviction Grading Model. The former is a core method used in institutional quantitative strategies to filter low-quality signals — signals are only generated when daily, weekly, and monthly timeframes simultaneously confirm resonance. The latter automatically grades every signal into three conviction levels — strong, moderate, and weak — enabling precise position sizing based on signal quality.
Confluence在图表上同时运行两套量化通道系统,各自独立追踪不同维度的市场数据。
第一套量化通道直接告诉你现在处于什么趋势环境——通道转为绿色,代表当前处于上升通道,趋势向上;通道转为红色,代表当前处于下降通道,趋势向下。你不需要判断,颜色已经告诉你答案。
Confluence runs two quantitative channel systems simultaneously on your chart, each independently tracking a different dimension of market data.
The first quantitative channel tells you directly what trend environment you're in — when the channel turns green, you are in an uptrend; when it turns red, you are in a downtrend. No judgment needed — the color tells you the answer.
第二套量化通道实时追踪另一个维度的市场方向。当两套量化通道同时指向同一个方向,多维度共振成立,这就是市场结构最清晰、操作确信度最高的时刻。
The second quantitative channel tracks market direction from another dimension. When both quantitative channels simultaneously point in the same direction, multi-dimensional resonance is confirmed — this is the moment of greatest market structure clarity and highest operational confidence.
最终呈现在你面前的,只有一件事:两套通道的颜色。
What's presented to you is simple: the color of the two channels.
🟢 绿色通道 → 上升趋势,多头结构
🟢 Green channel → Uptrend, bullish structure
🔴 红色通道 → 下降趋势,空头结构
🔴 Red channel → Downtrend, bearish structure
订阅后即可解锁Confluence完整使用指南,包括:
Subscribe to unlock the complete Confluence usage guide, including:
如何判断两套量化通道共振的强弱程度,什么级别值得重仓进场,什么级别只适合轻仓试探
How to judge the strength of two-channel resonance — what level warrants a full position and what level only warrants a light test position
哪个时间周期效果最好,日线、周线、小时线各有什么不同用法
Which timeframe works best — how daily, weekly, and hourly charts each serve a different purpose
通道颜色转变时的具体操作——绿色通道出现时应该如何布局,红色通道出现时应该如何应对
Exactly what to do when the channel color changes — how to position when the green channel appears and how to respond when the red channel appears
如何配合支撑位、压力位及副图系统使用,形成更高胜率的交易系统
How to combine with support and resistance levels and sub-chart systems to build a higher win-rate trading system
如何在TradingView上获得这个指标的专属授权,直接在你自己的账户上实时使用
How to obtain exclusive TradingView access to run this indicator live in your own account
25 套量化交易信号系统 · 完整交易生态系统
25 Quantitative Trading Signal Systems · A Complete Trading Ecosystem
我们提供的,从来不只是一套买卖信号工具。
What we offer has never been just a set of buy and sell signals.
Wealth Club 构建的是一个完整的交易生态系统——25 套量化买卖信号交易系统、深度研究报告、交易机会报告、核心持仓名单、高潜力名单、市场简报、市场前瞻与投资学堂,七大模块有机结合,覆盖从宏观研判到精准入场的完整交易闭环。
Wealth Club is built around a complete trading ecosystem — 25 quantitative signal trading systems, deep research reports, trading opportunity reports, core watchlist, high-potential watchlist, market briefs, market outlook, and investment academy. Seven integrated modules covering everything from macro analysis to precise entry execution — a complete trading loop.
订阅会员可获得完整访问权限,包括:
Subscribing members receive full access to:
交易机会报告
深度研究报告
潜力名单
核心名单
25 套专业交易系统完整使用权
Trading opportunity reports
Deep research reports
Potential watchlist
Core watchlist
Full access to all 25 professional trading systems
👉 查看完整使用指南:https://www.thewealthclub.vip/trading-system-2/
👉 View Full Usage Guide: https://www.thewealthclub.vip/trading-system-2/
逃顶抄底交易系统 · Top & Bottom Trading System
【主图 · Main Chart】
精准锁定市场极端高低点,在最佳位置逃顶抄底,捕捉最大化的价差空间。
Precisely locks onto extreme market highs and lows, enabling you to exit at the top and enter at the bottom — capturing the maximum price range in every move.
市场里最难的两件事,从来不是分析,而是知道什么时候该走,什么时候该进。
The two hardest things in the market are never the analysis — they are knowing when to exit, and when to enter.
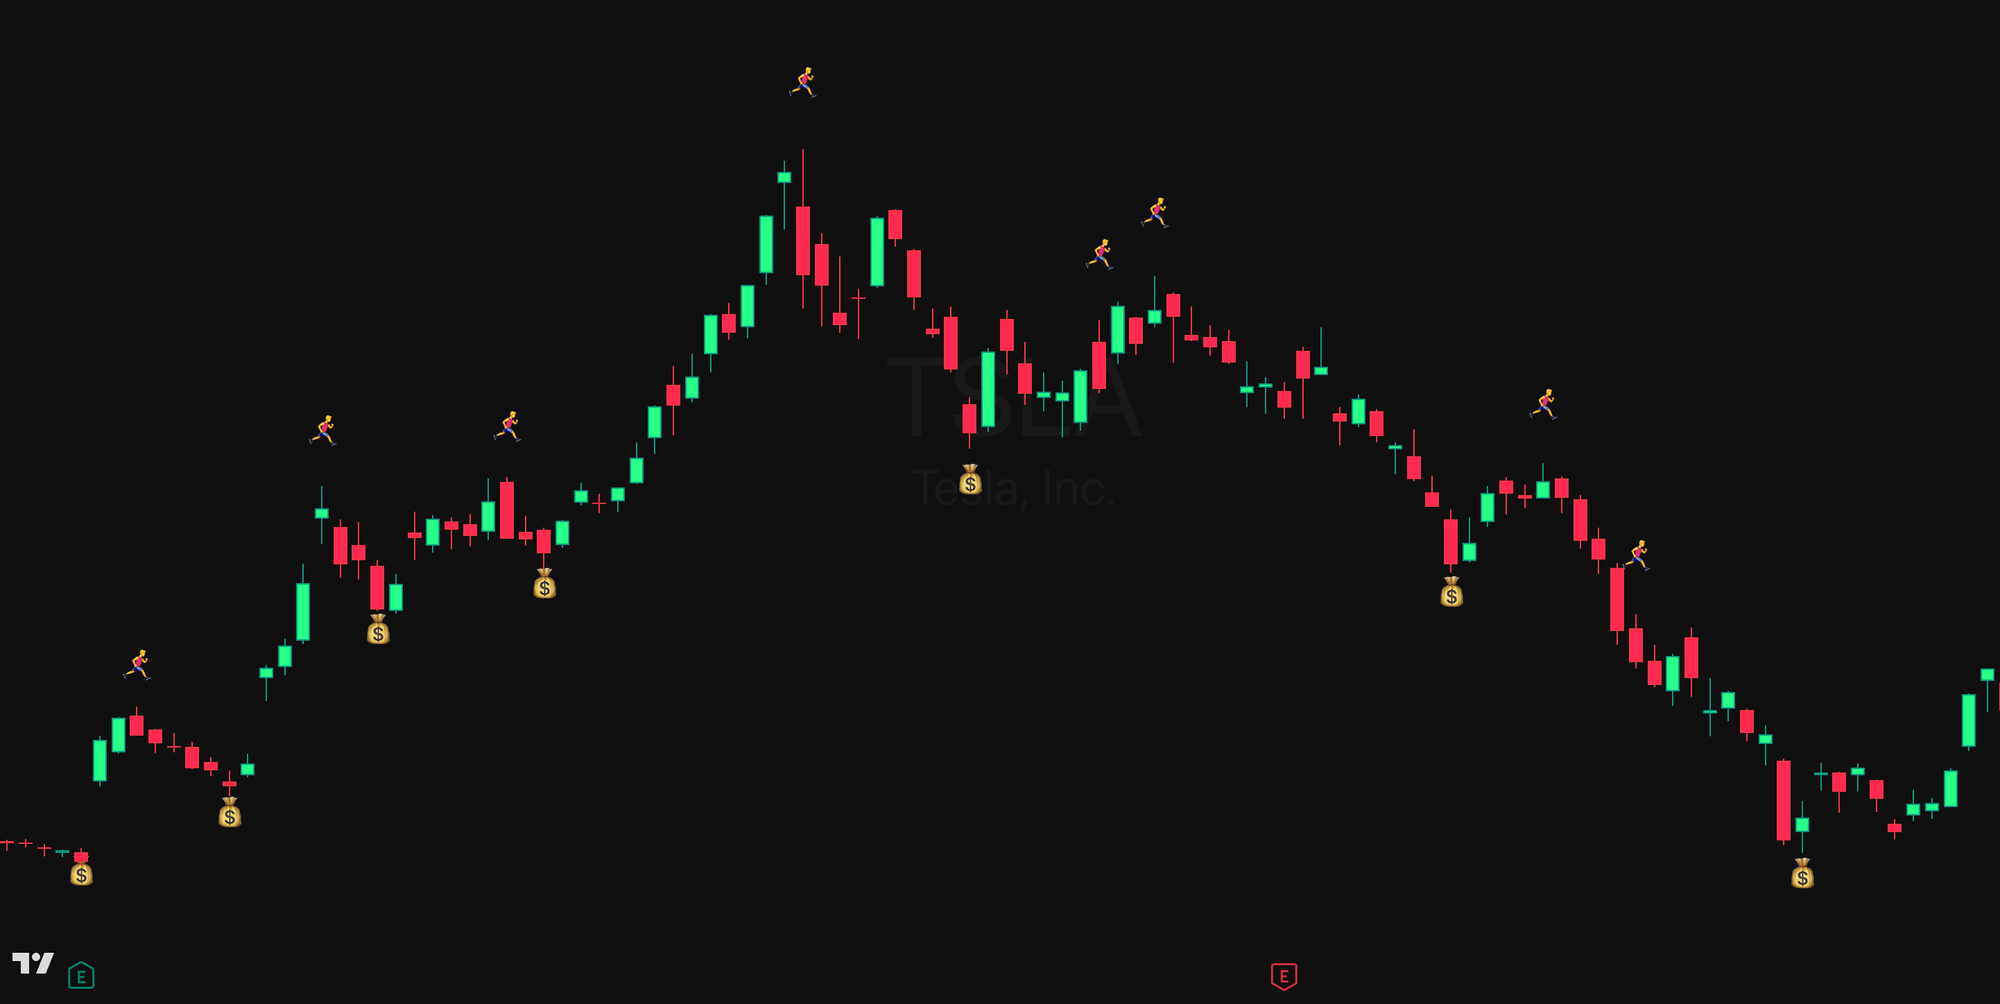
Top & Bottom Trading System · 逃顶抄底交易系统由财富俱乐部量化分析团队打造,专门解决这一个问题。系统通过多层量化模型实时监测市场的顶部与底部状态,在关键转折时刻自动发出信号——💰钱袋信号代表底部买入机会出现,🏃跑步信号代表顶部减仓机会出现。信号直接标注在K线图上,清晰直观,无需任何额外判断。
The Top & Bottom Trading System · 逃顶抄底交易系统 is built by the Wealth Club quantitative analysis team to solve exactly this. The system monitors market top and bottom conditions in real time through multi-layer quantitative models, automatically issuing signals at critical turning points — a 💰 money bag signal indicates a bottom buying opportunity, and a 🏃 runner signal indicates a top reduction opportunity. Signals are marked directly on the candlestick chart, clear and intuitive, requiring no additional interpretation.
无需成为图表专家,强大的算法自动为你绘制所有关键信息。适用于股票、加密货币、外汇和商品等任何金融市场,支持1m、5m、15m、1h、4H、1D等所有主流时间框架。无论你是日内交易者、波段交易者还是趋势交易者,Top & Bottom Trading System都能为你精准定位市场的关键顶底,让你像机构一样进行交易。
No need to be a chart expert. The powerful algorithm automatically plots all key information for you. Compatible with any financial market — stocks, crypto, forex, and commodities — across all major timeframes including 1m, 5m, 15m, 1h, 4H, and 1D. Whether you are a day trader, swing trader, or trend trader, the Top & Bottom Trading System precisely identifies key market tops and bottoms so you can trade like an institution.
这套系统做了什么?
What does this system do?
财富俱乐部量化分析团队通过以下四个维度构建这套系统:
深度量化研究公司财务数据
K线与趋势技术指标分析
机构主力资金流向监测
大数据与AI驱动的多因子模型
The Wealth Club quantitative analysis team built this system across four dimensions:
In-depth quantitative research of company financial data
Candlestick and trend technical indicator analysis
Institutional capital flow monitoring
Big data and AI-driven multi-factor model
在上述四个维度的基础上,Top & Bottom Trading System额外整合了价格周期极值识别模型(Price Cycle Extreme Detection Model)与多周期顶底共振验证引擎(Multi-Timeframe Top & Bottom Resonance Verification Engine)。前者通过对价格在不同时间维度上的极值分布进行深度统计分析,精准识别出具备反转意义的关键顶底区域;后者则通过同时扫描多个时间周期的顶底结构,只有当多个周期同时确认时,系统才发出信号,大幅提升信号的可靠性与精准度。
In addition to the four core dimensions, the Top & Bottom Trading System further integrates a Price Cycle Extreme Detection Model and a Multi-Timeframe Top & Bottom Resonance Verification Engine. The former conducts deep statistical analysis of price extreme distributions across different timeframes to precisely identify key top and bottom zones with genuine reversal significance. The latter simultaneously scans top and bottom structures across multiple timeframes, only issuing a signal when multiple timeframes simultaneously confirm — significantly improving signal reliability and precision.
最终呈现在你面前的,只有两件事:
What is ultimately presented to you is just two things:
💰 钱袋信号——底部机会出现,是潜在的买入时机
💰 Money bag signal — a bottom opportunity has appeared, indicating a potential entry point
🏃♂️➡️ 跑步信号——顶部机会出现,是潜在的减仓时机
🏃♂️➡️ Runner signal — a top opportunity has appeared, indicating a potential reduction point
你不再需要猜测市场的顶和底。系统已经为你标注好了。
You no longer need to guess where the market top or bottom is. The system has already marked it for you.
订阅后即可解锁Top & Bottom Trading System完整使用指南,包括:
Subscribe to unlock the complete Top & Bottom Trading System usage guide, including:
💰钱袋信号出现后应该如何进场,🏃♂️➡️跑步信号出现后应该如何阶段性锁利
How to enter after a money bag signal appears, and how to take staged profits after a runner signal appears
什么情况下信号可信度最高,什么情况下应该忽略
When signal reliability is highest and when signals should be ignored
哪个时间周期效果最好,日线、周线、小时线各有什么不同用法
Which timeframe works best — how daily, weekly, and hourly charts each serve a different purpose
如何配合支撑位、压力位及副图系统使用,形成更高胜率的交易系统
How to combine with support and resistance levels and sub-chart systems to build a higher win-rate trading approach
如何在TradingView上获得这个指标的专属授权,直接在你自己的账户上实时使用
How to obtain exclusive TradingView access to run this indicator live in your own account
25 套量化交易信号系统 · 完整交易生态系统
25 Quantitative Trading Signal Systems · A Complete Trading Ecosystem
交易系统均基于AI机器学习量化模型持续优化,系统数量将随优化进程动态调整。
All trading systems are continuously optimized through AI-driven machine learning and quantitative modelling. The number of systems is subject to change as optimization evolves.
我们提供的,从来不只是一套买卖信号工具。
What we offer has never been just a set of buy and sell signals.
Wealth Club 构建的是一个完整的交易生态系统——25 套量化买卖信号交易系统、深度研究报告、交易机会报告、核心持仓名单、高潜力名单、市场简报、市场前瞻与投资学堂,七大模块有机结合,覆盖从宏观研判到精准入场的完整交易闭环。
Wealth Club is built around a complete trading ecosystem — 25 quantitative signal trading systems, deep research reports, trading opportunity reports, core watchlist, high-potential watchlist, market briefs, market outlook, and investment academy. Seven integrated modules covering everything from macro analysis to precise entry execution — a complete trading loop.
订阅会员可获得完整访问权限,包括:
Subscribing members receive full access to:
交易机会报告
深度研究报告
潜力名单
核心名单
25 套专业交易系统完整使用权
Trading opportunity reports
Deep research reports
Potential watchlist
Core watchlist
Full access to all 25 professional trading systems
👉 查看完整使用指南:https://www.thewealthclub.vip/trading-system-5/
👉 View Full Usage Guide: https://www.thewealthclub.vip/trading-system-5/

主力猎手交易系统 · Smart Money Hunter Trading System
【主图 · Main Chart】
实时追踪机构主力资金动向,跟随聪明钱布局,在主力入场的第一时间同步行动。
Tracks institutional smart money movements in real time — follow where the big players position, and act in sync the moment smart money enters the market.
市场里最难看见的,从来不是价格,而是价格背后的资金。散户看的是K线,主力看的是筹码。当你还在分析图表的时候,真正的资金早已悄悄完成了布局。
The hardest thing to see in the market is never the price — it's the capital behind it. Retail traders watch candles. Institutions watch positioning. By the time most people react, smart money has already moved.
Smart Money Hunter Trading System · 主力猎手交易系统由财富俱乐部量化分析团队打造,专门解决这一个问题——让你第一时间看见主力资金的真实动向,在机构完成布局之前,提前站到正确的一边。
The Smart Money Hunter Trading System · 主力猎手交易系统 is built by the Wealth Club quantitative analysis team to solve exactly this — giving you real-time visibility into institutional capital flow so you can position yourself before the move happens.
图表上只有四件事:红色与黄色柱代表主力资金正在进场,绿色柱代表主力资金正在撤退出货,蓝色柱代表极度超卖抄底机会出现,💰钱袋信号代表主力开始积极买入,🏃♂️➡️跑步信号代表主力已经开始撤退。
What appears on your chart is simple: red and yellow columns mean institutional capital is entering, green columns mean it is exiting, blue columns signal an extreme oversold bottom-fishing opportunity, a 💰 money bag means smart money is actively accumulating, and a 🏃 runner means smart money has begun to exit.
无需成为图表专家,强大的算法自动为你绘制所有关键信息。适用于股票、加密货币、外汇和商品等任何金融市场,支持1m、5m、15m、1h、4H、1D等所有主流时间框架。无论你是日内交易者、波段交易者还是趋势交易者,Smart Money Hunter都能为你实时呈现主力资金的动向,让你像机构一样进行交易。
No need to be a chart expert. The powerful algorithm automatically plots all key information for you. Compatible with any financial market — stocks, crypto, forex, and commodities — across all major timeframes including 1m, 5m, 15m, 1h, 4H, and 1D. Whether you are a day trader, swing trader, or trend trader, Smart Money Hunter gives you real-time visibility into institutional capital flow so you can trade like an institution.
这套系统做了什么?
What does this system do?
财富俱乐部量化分析团队通过以下四个维度构建这套系统:
深度量化研究公司财务数据
K线与趋势技术指标分析
机构主力资金流向监测
大数据与AI驱动的多因子模型
The Wealth Club quantitative analysis team built this system across four dimensions:
In-depth quantitative research of company financial data
Candlestick and trend technical indicator analysis
Institutional capital flow monitoring
Big data and AI-driven multi-factor model
在上述四个维度的基础上,Smart Money Hunter系统额外整合了机构资金行为特征识别矩阵(Institutional Capital Behavior Signature Matrix)与超卖极值动能反转评估模型(Oversold Extreme Momentum Reversal Assessment Model)。前者通过对市场微观结构的深度解析,识别出隐藏在普通成交量背后的机构资金行为特征,将主力进场、主力出货与市场噪音精准区分;后者则持续监测价格在历史维度上的极端低位状态,当多个量化指标同时触及临界阈值时,系统自动判定当前位置具备反转潜力,并以蓝色柱直观呈现。
In addition to the four core dimensions, the Smart Money Hunter system further integrates an Institutional Capital Behavior Signature Matrix and an Oversold Extreme Momentum Reversal Assessment Model. The former conducts deep analysis of market microstructure to identify institutional capital behaviour patterns hidden beneath ordinary volume — precisely separating smart money accumulation, distribution, and market noise. The latter continuously monitors price across a historical dimension for extreme low-zone conditions, and when multiple quantitative indicators simultaneously reach critical thresholds, the system determines that the current position carries reversal potential and presents it visually through a blue column.
最终呈现在你面前的,只有一件事:颜色告诉你主力什么时候进场,什么时候退出。在别人还看不见的时候,你已经看见了。在别人还在等待的时候,你已经准备好了。这,就是信息比别人早一步的价值。
What is ultimately presented to you is just one thing: the colour tells you when smart money is entering, and when it is walking away. While others are still searching for signals, you already have the answer. While others are still waiting, you are already positioned. That is the value of seeing what others cannot — one step ahead.
订阅后即可解锁Smart Money Hunter完整使用指南,包括:
Subscribe to unlock the complete Smart Money Hunter usage guide, including:
红色、黄色、绿色、蓝色柱各代表什么,应该如何配合操作
What each colour column represents and how to act on them
💰钱袋与🏃♂️➡️跑步信号出现时应该如何操作
How to act when the money bag and runner signals appear
哪个时间周期效果最好,日线、周线、小时线各有什么不同用法
Which timeframe works best — how daily, weekly, and hourly charts each serve a different purpose
如何配合支撑位、压力位及其他副图系统使用,形成更高胜率的交易系统
How to combine with support and resistance levels and other sub-chart systems to build a higher win-rate trading approach
如何在TradingView上获得这个指标的专属授权,直接在你自己的账户上实时使用
How to obtain exclusive TradingView access to run this indicator live in your own account
25 套量化交易信号系统 · 完整交易生态系统
25 Quantitative Trading Signal Systems · A Complete Trading Ecosystem
交易系统均基于AI机器学习量化模型持续优化,系统数量将随优化进程动态调整。
All trading systems are continuously optimized through AI-driven machine learning and quantitative modelling. The number of systems is subject to change as optimization evolves.
我们提供的,从来不只是一套买卖信号工具。
What we offer has never been just a set of buy and sell signals.
Wealth Club 构建的是一个完整的交易生态系统——24套量化买卖信号交易系统、深度研究报告、交易机会报告、核心持仓名单、高潜力名单、市场简报、市场前瞻与投资学堂,七大模块有机结合,覆盖从宏观研判到精准入场的完整交易闭环。
Wealth Club is built around a complete trading ecosystem — 24 quantitative signal trading systems, deep research reports, trading opportunity reports, core watchlist, high-potential watchlist, market briefs, market outlook, and investment academy. Seven integrated modules covering everything from macro analysis to precise entry execution — a complete trading loop.
订阅会员可获得完整访问权限,包括:
Subscribing members receive full access to:
交易机会报告
深度研究报告
潜力名单
核心名单
25 套专业交易系统完整使用权
Trading opportunity reports
Deep research reports
Potential watchlist
Core watchlist
Full access to all 25 professional trading systems
👉 查看完整使用指南:https://www.thewealthclub.vip/trading-system-4/
👉 View Full Usage Guide: https://www.thewealthclub.vip/trading-system-4/
智能支撑压力交易系统 · Auto Support & Resistance Trading System
【主图 · Main Chart】
自动识别并实时绘制市场关键支撑与压力位,价格记忆比你想象的更长,精准把握每一次突破与反弹机会。
Automatically identifies and draws key support and resistance levels in real time — price memory runs deeper than most realize, precisely capturing every breakout and bounce opportunity.
价格的记忆比你想象的更长。支撑和阻力,是市场留下最深的两道印记。
Price has a longer memory than most traders realize. Support and resistance are the two deepest marks the market leaves behind.
大多数散户凭感觉画支撑线和阻力线,画错了不知道,画对了也不确定。Auto Support & Resistance Trading System · 智能支撑压力交易系统由财富俱乐部量化分析团队打造,用算法自动识别图表上真正有意义的支撑位与阻力位,并在价格突破或跌破这些关键位置时自动发出信号——让你不再凭感觉画线,让每一条线都有数据支撑。
Most retail traders draw support and resistance lines by feel — wrong without knowing it, right without being sure. The Auto Support & Resistance Trading System · 智能支撑压力交易系统, built by the Wealth Club quantitative analysis team, uses an algorithm to automatically identify genuinely meaningful support and resistance levels on the chart, and automatically signals when price breaks through or falls below these key levels — so you never draw lines by guesswork again, and every line has data behind it.
无需成为图表专家,强大的算法自动为你绘制所有关键信息。适用于股票、加密货币、外汇和商品等任何金融市场,支持1m、5m、15m、1h、4H、1D等所有主流时间框架。无论你是日内交易者、波段交易者还是趋势交易者,Auto Support & Resistance都能为你精准标注市场的关键价格区域,让你像机构一样进行交易。
No need to be a chart expert. Our powerful algorithm automatically plots all key information for you. Compatible with any financial market — stocks, crypto, forex, and commodities — across all major timeframes including 1m, 5m, 15m, 1h, 4H, and 1D. Whether you're a day trader, swing trader, or trend trader, Auto Support & Resistance precisely marks the market's key price zones so you can trade like an institution.
这套系统做了什么?
What does this system do?
财富俱乐部量化分析团队通过以下四个维度构建这套系统:
深度量化研究公司财务数据
K线与趋势技术指标分析
机构主力资金流向监测
大数据与AI驱动的多因子模型
The Wealth Club quantitative analysis team built this system across four dimensions:
In-depth quantitative research of company financial data
Candlestick and trend technical indicator analysis
Institutional capital flow monitoring
Big data and AI-driven multi-factor model
在上述四个维度的基础上,Auto Support & Resistance系统额外整合了多周期价格结构枢纽识别算法(Multi-Period Price Structure Pivot Detection)与突破有效性筛选模型(Breakout Validity Filtering)。前者通过扫描价格在一定周期内的高低点结构,精确锁定市场在统计意义上反复确认的关键价格区域——这些区域正是机构资金在历史上反复进出的位置;后者则通过评估突破时的收盘价位置与方向,过滤假突破信号,只在价格真正完成有效突破时才发出提示。
In addition to the four core dimensions, the Auto Support & Resistance system further integrates a Multi-Period Price Structure Pivot Detection Algorithm and a Breakout Validity Filtering Model. The former scans the high and low structure of price over a defined period to precisely lock in key price zones that the market has repeatedly confirmed on a statistical basis — these are the exact zones where institutional capital has historically entered and exited. The latter evaluates the closing price position and direction at the moment of breakout, filtering false breakout signals and only alerting when price has genuinely completed a valid move through a key level.
Auto Support & Resistance在主图上自动绘制两类关键价格线,并在突破时发出信号。红色水平线标注阻力位——价格在此区域曾多次遭遇卖压,是市场的历史高点结构;绿色水平线标注支撑位——价格在此区域曾多次获得买盘支撑,是市场的历史低点结构。当价格向上突破阻力位,图表自动出现绿色向上箭头▲;当价格向下跌破支撑位,图表自动出现红色向下箭头▼。
Auto Support & Resistance automatically plots two types of key price lines on the main chart and signals at breakout moments. Red horizontal lines mark resistance levels — zones where price has previously encountered selling pressure multiple times, representing historical high-point structure. Green horizontal lines mark support levels — zones where price has previously received buying support multiple times, representing historical low-point structure. When price breaks upward through a resistance level, a green upward arrow ▲ automatically appears on the chart. When price breaks downward through a support level, a red downward arrow ▼ appears.
最终呈现在你面前的,只有两件事:图表上自动绘制的支撑位与阻力位,和突破时出现的方向信号。
What's presented to you is simple: automatically plotted support and resistance levels on the chart, and directional signals when those levels are broken.
🟢 绿色水平线 → 支撑位,价格在此获得买盘
🟢 Green horizontal line → Support level, where price finds buying support
🔴 红色水平线 → 阻力位,价格在此遭遇卖压
🔴 Red horizontal line → Resistance level, where price encounters selling pressure
▲ 绿色向上箭头 → 有效突破阻力位,潜在买入机会
▲ Green upward arrow → Valid breakout above resistance, potential buy opportunity
▼ 红色向下箭头 → 有效跌破支撑位,潜在减仓提示
▼ Red downward arrow → Valid breakdown below support, potential reduction alert
订阅后即可解锁Auto Support & Resistance完整使用指南,包括:
Subscribe to unlock the complete Auto Support & Resistance usage guide, including:
如何结合支撑位和阻力位判断入场时机,突破确认后应该如何配合仓位管理。
How to use support and resistance levels to time entries, and how to manage position sizing after a breakout is confirmed.
哪个时间周期效果最好,日线、周线、小时线各有什么不同用法。
Which timeframe works best — how daily, weekly, and hourly charts each serve a different purpose.
如何避免假突破,▲和▼信号出现后应该观察哪些确认条件再行动。
How to avoid false breakouts, and what confirmation conditions to observe before acting on ▲ and ▼ signals.
如何配合Sigma · 顶底捕捉交易系统或Zone · 热度预警交易系统共同确认,形成更高胜率的交易决策。
How to combine with the Sigma · Top & Bottom Detection Trading System or Zone · Heat Alert Trading System for confirmation, building higher win-rate trading decisions.
如何在TradingView上获得这个指标的专属授权,直接在你自己的账户上实时使用。
How to obtain exclusive TradingView access to run this indicator live in your own account.
25 套量化交易信号系统 · 完整交易生态系统
25 Quantitative Trading Signal Systems · A Complete Trading Ecosystem
交易系统均基于AI机器学习量化模型持续优化,系统数量将随优化进程动态调整。
All trading systems are continuously optimized through AI-driven machine learning and quantitative modelling. The number of systems is subject to change as optimization evolves.
我们提供的,从来不只是一套买卖信号工具。
What we offer has never been just a set of buy and sell signals.
Wealth Club 构建的是一个完整的交易生态系统——25 套量化买卖信号交易系统、深度研究报告、交易机会报告、核心持仓名单、高潜力名单、市场简报、市场前瞻与投资学堂,七大模块有机结合,覆盖从宏观研判到精准入场的完整交易闭环。
Wealth Club is built around a complete trading ecosystem — 25 quantitative signal trading systems, deep research reports, trading opportunity reports, core watchlist, high-potential watchlist, market briefs, market outlook, and investment academy. Seven integrated modules covering everything from macro analysis to precise entry execution — a complete trading loop.
订阅会员可获得完整访问权限,包括:
Subscribing members receive full access to:
交易机会报告
深度研究报告
潜力名单
核心名单
25 套专业交易系统完整使用权
Trading opportunity reports
Deep research reports
Potential watchlist
Core watchlist
Full access to all 25 professional trading systems
👉 查看完整使用指南:https://www.thewealthclub.vip/trading-system-6/
👉 View Full Usage Guide: https://www.thewealthclub.vip/trading-system-6/
高低点捕捉交易系统 · Pivot Trading System
【主图 · Main Chart】
自动标记市场关键高低点与枢轴位,精准定位每一次价格转折的核心区域,让交易决策有据可依。
Automatically marks key market highs, lows, and pivot levels — precisely locating the core zones of every price turning point, giving your trading decisions a solid foundation.
市场最贵的两个位置,一个是顶,一个是底。能提前看见它们的人,赚的是最干净的钱。
The two most valuable positions in the market are the top and the bottom. Those who can see them in advance make the cleanest profits.
散户最常犯的错误有两个:在顶部追进去,在底部割出来。不是因为他们不懂道理,而是因为在关键时刻,他们没有一个客观的系统告诉他们——这里,就是转折点。Pivot Trading System · 高低点捕捉交易系统由财富俱乐部量化分析团队打造,专门解决这一个问题——在价格到达关键高低点的时候,系统自动告诉你。
The two most common mistakes retail traders make are buying at the top and selling at the bottom. Not because they don't understand the theory, but because at critical moments, they don't have an objective system telling them — this is the turning point. The Pivot Trading System · 高低点捕捉交易系统, built by the Wealth Club quantitative analysis team, is designed to solve exactly this — when price reaches a key high or low point, the system automatically tells you.
无需成为图表专家,强大的算法自动为你绘制所有关键信息。适用于股票、加密货币、外汇和商品等任何金融市场,支持1m、5m、15m、1h、4H、1D等所有主流时间框架。无论你是日内交易者、波段交易者还是趋势交易者,Pivot都能为你精准定位市场的关键转折点,让你像机构一样进行交易。
No need to be a chart expert. Our powerful algorithm automatically plots all key information for you. Compatible with any financial market — stocks, crypto, forex, and commodities — across all major timeframes including 1m, 5m, 15m, 1h, 4H, and 1D. Whether you're a day trader, swing trader, or trend trader, Pivot precisely identifies the market's critical turning points so you can trade like an institution.
这套系统做了什么?
What does this system do?
财富俱乐部量化分析团队通过以下四个维度构建这套系统:
深度量化研究公司财务数据
K线与趋势技术指标分析
机构主力资金流向监测
大数据与AI驱动的多因子模型
The Wealth Club quantitative analysis team built this system across four dimensions:
In-depth quantitative research of company financial data
Candlestick and trend technical indicator analysis
Institutional capital flow monitoring
Big data and AI-driven multi-factor model
在上述四个维度的基础上,Pivot系统额外整合了价格弹性强度模型(Price Elasticity Strength Model)与关键支撑阻力区间自动识别算法(Auto S/R Zone Detection)。前者源自机构风险管理中对价格回撤深度与反弹力度的量化评估框架,用于衡量每一个关键高低点的有效性;后者则通过历史成交密集区与机构持仓成本区的大数据分析,自动标注出市场最有可能发生反应的价格区间。
In addition to the four core dimensions, the Pivot system further integrates a Price Elasticity Strength Model and an Auto Support/Resistance Zone Detection Algorithm. The former is derived from institutional risk management frameworks that quantitatively assess pullback depth and rebound strength, measuring the validity of each key high and low. The latter uses big data analysis of historical high-volume price clusters and estimated institutional cost zones to automatically mark the price levels where the market is most likely to react.
Pivot是所有主图系统里视觉上最干净的一套。图表上没有通道,没有色带,没有任何多余的线条。只有一件事:在关键高低点自动出现的蓝色Buy标签和粉红色Sell标签。系统的底层逻辑融合了多周期高低点识别算法、价格结构分析,以及对历史转折点规律的深度统计研究。每一个信号的触发,都经过多个条件的同时验证。
Pivot is the cleanest main chart system in the suite. No channels, no color bands, no extra lines on the chart. Just one thing: blue Buy labels and pink Sell labels that automatically appear at key high and low points. The underlying logic integrates multi-timeframe high-low point identification algorithms, price structure analysis, and deep statistical research into historical turning point patterns. Every signal is triggered only after multiple conditions are simultaneously verified.
最终呈现在你面前的,只有两件事:图表上的Buy,和图表上的Sell。
What's presented to you is simple: Buy on the chart, and Sell on the chart.
高点和低点,它直接标出来。
The highs and the lows — marked directly on your chart.
Buy / Sell 直接出现在你的K线图上。
Buy / Sell appears right on your candlestick chart.
你还在猜,它已经给答案。
While you're still guessing, it already has the answer.
不需要分析,只需要执行。
No analysis needed. Just execute.
订阅后即可解锁Pivot完整使用指南,包括:
Subscribe to unlock the complete Pivot usage guide, including:
Buy信号出现后应该如何进场,Sell信号出现后应该如何阶段性锁利,什么情况下信号可信度最高
How to enter after a Buy signal appears, how to take staged profits after a Sell signal appears, and when signal reliability is highest
哪个时间周期效果最好,日线、周线、小时线各有什么不同用法
Which timeframe works best — how daily, weekly, and hourly charts each serve a different purpose
如何避免假突破和假跌破,什么情况下Buy信号应该忽略
How to avoid false breakouts and false breakdowns, and when a Buy signal should be ignored
如何配合支撑位、压力位及副图系统使用,形成更高胜率的交易系统
How to combine with support and resistance levels and sub-chart systems to build a higher win-rate trading system
如何在TradingView上获得这个指标的专属授权,直接在你自己的账户上实时使用
How to obtain exclusive TradingView access to run this indicator live in your own account
25 套量化交易信号系统 · 完整交易生态系统
25 Quantitative Trading Signal Systems · A Complete Trading Ecosystem
交易系统均基于AI机器学习量化模型持续优化,系统数量将随优化进程动态调整。
All trading systems are continuously optimized through AI-driven machine learning and quantitative modelling. The number of systems is subject to change as optimization evolves.
我们提供的,从来不只是一套买卖信号工具。
What we offer has never been just a set of buy and sell signals.
Wealth Club 构建的是一个完整的交易生态系统——25 套量化买卖信号交易系统、深度研究报告、交易机会报告、核心持仓名单、高潜力名单、市场简报、市场前瞻与投资学堂,七大模块有机结合,覆盖从宏观研判到精准入场的完整交易闭环。
Wealth Club is built around a complete trading ecosystem — 25 quantitative signal trading systems, deep research reports, trading opportunity reports, core watchlist, high-potential watchlist, market briefs, market outlook, and investment academy. Seven integrated modules covering everything from macro analysis to precise entry execution — a complete trading loop.
订阅会员可获得完整访问权限,包括:
Subscribing members receive full access to:
交易机会报告
深度研究报告
潜力名单
核心名单
25 套专业交易系统完整使用权
Trading opportunity reports
Deep research reports
Potential watchlist
Core watchlist
Full access to all 25 professional trading systems
👉 查看完整使用指南:https://www.thewealthclub.vip/trading-system-pivot-trading-system/
👉 View Full Usage Guide: https://www.thewealthclub.vip/trading-system-pivot-trading-system/
反转捕捉交易系统 · Reversal Trading System
【主图 · Main Chart】
捕捉市场每一次趋势反转的起始信号,在转折点出现的第一时间发出预警,让你在反转初期精准入场。
Captures the initial signal of every market trend reversal, alerting you the moment a turning point emerges — so you can enter precisely at the earliest stage of every reversal.
当大多数人还在下跌里害怕、在上涨里犹豫,Reversal Trading System已经开始帮你识别市场真正的转折区域。
While most traders are still afraid during declines and hesitant during rebounds, the Reversal Trading System is already helping you identify where the market is actually beginning to turn.
市场里最难赚的一段,往往不是趋势中间,而是趋势刚刚反过来的那一段。因为那个位置最不确定,噪音最多,情绪最乱。多数散户会在这里做两件事:要么在跌深后不敢买,要么在反弹初期不相信,等真正涨起来后才开始追。结果不是错过最好的成本,就是在反转已经走完一段后接在更高的位置。
The most valuable part of the market is often not the middle of a trend, but the exact stretch where the trend begins to reverse. That area is also where uncertainty is highest, noise is greatest, and emotions are the most unstable. Most retail traders do one of two things there: either they become too afraid to buy after a decline, or they do not believe the rebound early enough and only chase after the move is already well underway.
Reversal Trading System · 反转捕捉交易系统由财富俱乐部量化分析团队打造,核心目标不是让你追逐已经走出来的趋势,而是帮助你更早识别"下跌结束、修复开始、反转形成"这一整段结构变化。它把复杂的节奏修复、结构切换、关键高低点和突破确认,压缩成副图上一套更容易执行的视觉语言。你看到的不只是价格反弹,而是反弹背后到底有没有形成真正的反转条件。
Built by the Wealth Club quantitative analysis team, the Reversal Trading System · 反转捕捉交易系统 is not designed to help you chase trends that are already obvious. Its purpose is to help you identify earlier when a decline is ending, a repair phase is beginning, and a real reversal structure is starting to form. It compresses rhythm repair, structure switching, pivot confirmation, and breakout validation into a more actionable visual language on the sub chart. What you see is not merely a rebound. You see whether the rebound has the conditions to become a reversal.
这套系统虽然放在副图,但它并不是拿来"辅助看看而已"的。它的作用非常明确:帮助你在市场最混乱、最犹豫、最容易看错的位置,把反转的质量区分出来。图上最核心的元素仍然很清楚:一条更敏感的短周期动能线、一条更稳定的中周期基准线、Buy / Sell 提示、"9"字节奏提醒,以及Breakout标记。信息不复杂,但足以把"只是反弹"和"开始反转"分出来。
Although this system is used in the sub chart, it is not just a secondary visual aid. Its function is very clear: to help you distinguish the quality of a reversal at the exact places where the market is most chaotic, most hesitant, and easiest to misread. The core chart elements remain clean and simple: a more sensitive short-cycle momentum line, a steadier medium-cycle baseline, Buy / Sell prompts, "9" rhythm markers, and Breakout labels. The information is not complicated, but it is enough to separate "just a bounce" from "the beginning of a reversal."
它适用于股票、加密货币、外汇和商品等各类市场,支持1m、5m、15m、1h、4H、1D等主流时间框架。无论你是想做超跌反弹、波段反转,还是趋势转向初期的低位布局,Reversal Trading System都会让你更快看清市场到底是在修复,还是已经开始真正翻转。
It works across stocks, crypto, forex, and commodities, and across major timeframes including 1m, 5m, 15m, 1h, 4H, and 1D. Whether you are trying to trade oversold rebounds, swing reversals, or early-stage trend turns, the Reversal Trading System helps you read much faster whether the market is merely repairing or actually beginning to reverse.
这套系统做了什么?
What does this system do?
财富俱乐部量化分析团队通过以下四个维度构建这套系统:
下跌衰竭与反转节奏识别
多周期动能修复与结构切换监测
关键高低点与拐点确认
反转突破与失败反转筛选
The Wealth Club quantitative analysis team built this system across four dimensions:
Downside exhaustion and reversal-rhythm recognition
Multi-timeframe momentum repair and structure-switch monitoring
Key pivot and turning-point confirmation
Reversal breakout and failed-reversal filtering
在这四个维度之上,Reversal Trading System把最关键的反转信息集中在副图呈现出来。绿色与粉红色线段,告诉你短周期动能目前偏向修复还是偏向走弱;蓝色基准线,告诉你中周期结构是否已经开始配合;Buy与Sell,告诉你哪些局部高低点开始具备了反转观察价值;"9"字提醒,则告诉你当前这一段下跌或上涨节奏已经运行到相对极端的位置,风险收益比正在重新变化。
On top of these four dimensions, the Reversal Trading System concentrates the most important reversal information into the sub chart. The green and pink line segments show whether short-cycle momentum is repairing or weakening. The blue baseline shows whether the medium-cycle structure is starting to support the move. Buy and Sell indicate which local pivots are beginning to carry reversal significance. The "9" marker tells you that a decline or advance has already reached a relatively extended rhythm extreme and that the risk-reward profile is changing again.
这里最重要的一点是:这套系统的真实视觉逻辑,不是靠通道填充色,而是靠线段状态本身。短周期线由粉红转绿,代表反转修复开始增强;由绿转粉红,代表反弹衰减、下行节奏重新占优。蓝色基准线本身更慢、更稳,它不是用来追每一根K线的,而是用来判断这次修复到底有没有开始上升到"结构性反转"的级别。
The most important point is this: the real visual logic of this system is not based on a filled channel, but on the state of the line segments themselves. When the short-cycle line turns from pink to green, reversal repair is strengthening. When it turns from green back to pink, the rebound is fading and downside rhythm is regaining control. The blue baseline is slower and steadier. It is not there to chase every candle, but to judge whether the repair is rising to the level of a structural reversal.
最终呈现在你面前的,只有几件真正重要的事:反转是否开始、修复是否持续、关键拐点是否成立,以及图表上的Buy / Sell。
What ultimately appears in front of you is simple: whether the reversal is beginning, whether the repair is sustaining, whether the pivot is valid, and where Buy / Sell appears on the chart.
订阅后即可解锁Reversal Trading System完整使用指南,包括:
Subscribe to unlock the complete Reversal Trading System usage guide, including:
具体怎么用这套系统进行反转买卖决策,包括信号出现后应该如何配合仓位管理。
Exactly how to use this system for reversal buy and sell decisions, including position sizing after a signal appears.
哪个时间周期效果最好,日线、周线、小时线各有什么不同用法。
Which timeframe works best — how daily, weekly, and hourly charts each serve a different purpose.
如何避免假反转信号,什么情况下Buy信号应该忽略。
How to avoid false reversal signals and when a Buy signal should be ignored.
"9"字提醒在反转结构里分别意味着什么,什么时候只是提醒,什么时候价值更高。
What the "9" marker means inside a reversal structure, and when it matters more.
Breakout提示什么时候代表反转确认,什么时候只是短线冲高。
When a Breakout label confirms reversal structure and when it is only a short-term spike.
如何配合Auto Support & Resistance Trading System · 智能支撑压力交易系统的支撑位与压力位,以及Sigma · 顶底捕捉交易系统或Zone · 热度预警交易系统共同确认,形成更高胜率的交易系统。
How to combine with the support and resistance levels from the Auto Support & Resistance Trading System · 智能支撑压力交易系统, and confirmation from the Sigma · Top & Bottom Detection Trading System or Zone · Heat Alert Trading System, to build a higher win-rate trading system.
如何在TradingView上获得这个指标的专属授权,直接在你自己的账户上实时使用。
How to obtain exclusive TradingView access to run this indicator live in your own account.
25 套量化交易信号系统 · 完整交易生态系统
25 Quantitative Trading Signal Systems · A Complete Trading Ecosystem
交易系统均基于AI机器学习量化模型持续优化,系统数量将随优化进程动态调整。
All trading systems are continuously optimized through AI-driven machine learning and quantitative modelling. The number of systems is subject to change as optimization evolves.
我们提供的,从来不只是一套买卖信号工具。
What we offer has never been just a set of buy and sell signals.
Wealth Club 构建的是一个完整的交易生态系统——25 套量化买卖信号交易系统、深度研究报告、交易机会报告、核心持仓名单、高潜力名单、市场简报、市场前瞻与投资学堂,七大模块有机结合,覆盖从宏观研判到精准入场的完整交易闭环。
Wealth Club is built around a complete trading ecosystem — 25 quantitative signal trading systems, deep research reports, trading opportunity reports, core watchlist, high-potential watchlist, market briefs, market outlook, and investment academy. Seven integrated modules covering everything from macro analysis to precise entry execution — a complete trading loop.
订阅会员可获得完整访问权限,包括:
Subscribing members receive full access to:
交易机会报告
深度研究报告
潜力名单
核心名单
25套专业交易系统完整使用权
Trading opportunity reports
Deep research reports
Potential watchlist
Core watchlist
Full access to all 25 professional trading systems
👉 查看完整使用指南:https://www.thewealthclub.vip/trading-system-reversal-trading-system/
👉 View Full Usage Guide: https://www.thewealthclub.vip/trading-system-reversal-trading-system/
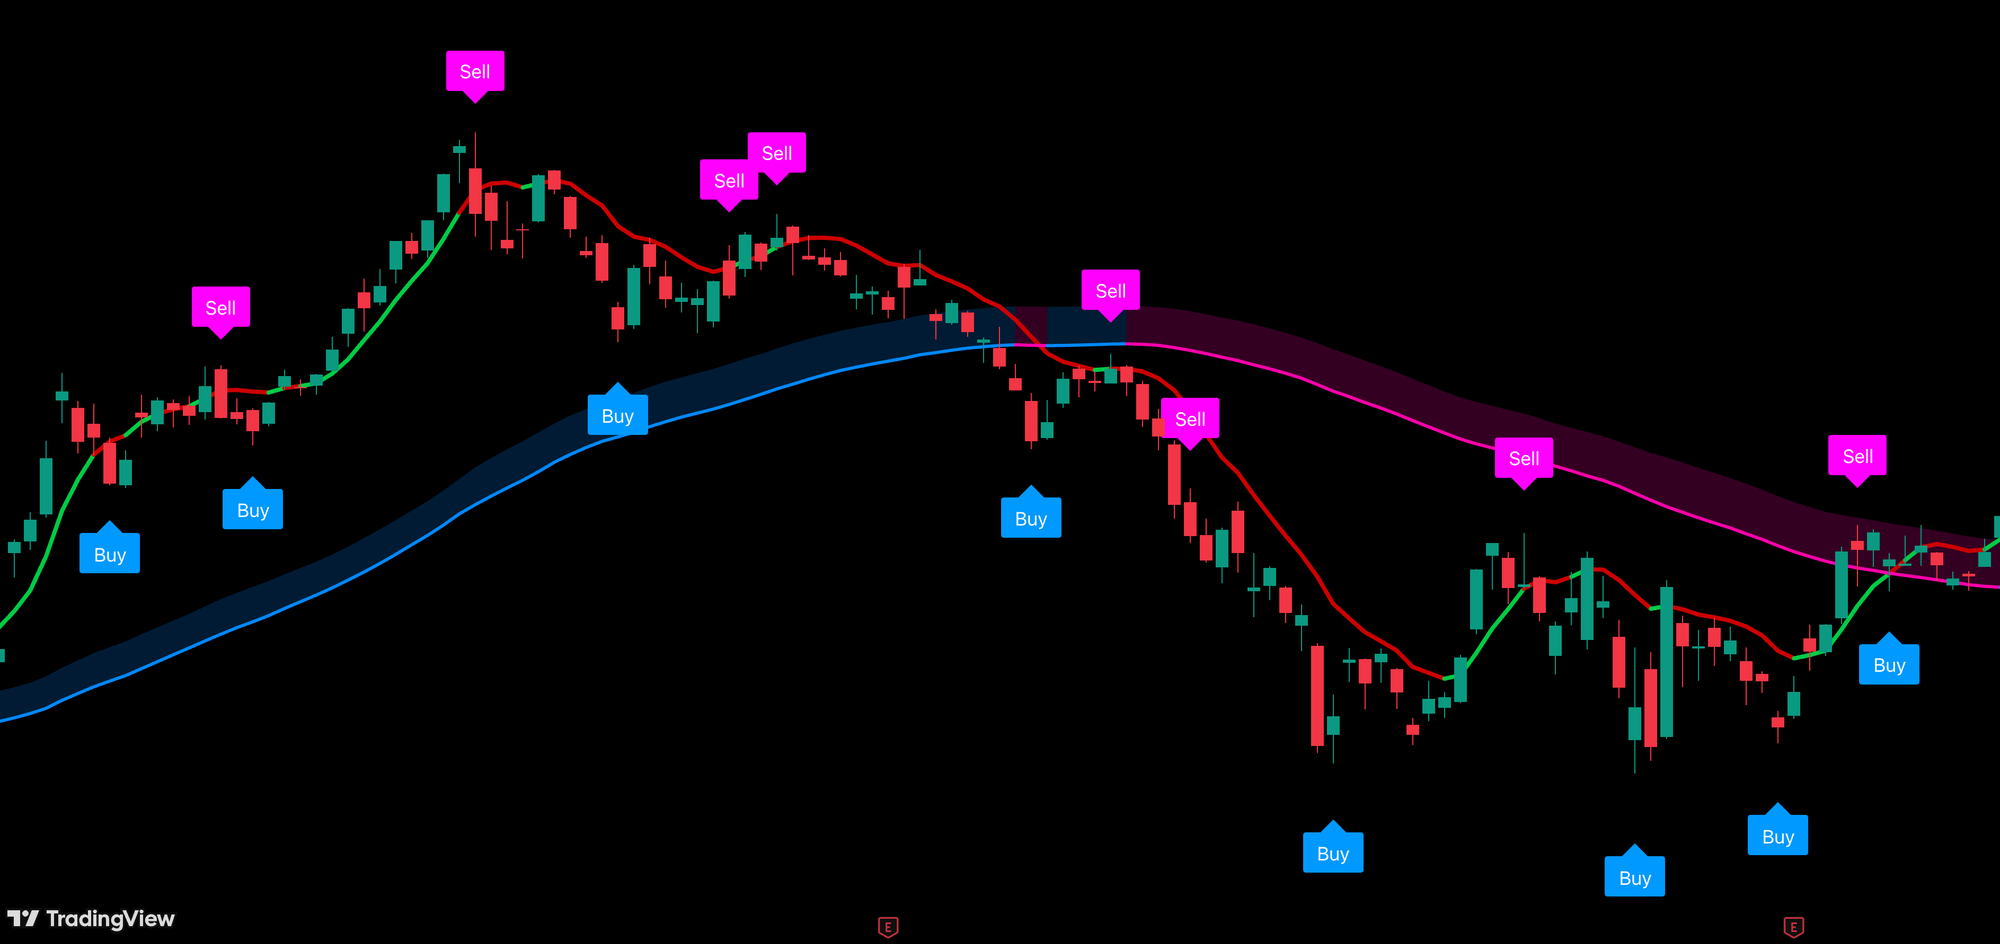
巅峰交易系统 · Apex Pro Trading System
【主图 · Main Chart】
集成多重进阶量化策略于一体,以最高精度捕捉市场中最具爆发力的交易机会,为追求卓越表现的交易者而生。
Integrates multiple advanced quantitative strategies into one system, capturing the most explosive trading opportunities in the market with the highest precision — built for traders who demand peak performance.
看见方向只是第一步。知道什么时候出手,才是真正的优势。
Seeing the direction is only the first step. Knowing exactly when to act — that's the real edge.
大多数人看得见趋势,却在错误的时机入场。不是因为他们不懂方向,而是因为在关键时刻,他们没有一个客观的系统告诉他们——现在,就是时候了。Apex Pro Trading System · 巅峰交易系统由财富俱乐部量化分析团队打造,在双重量化框架的基础上,系统自动在关键价格结构节点标出买入和卖出信号,让趋势判断和入场时机同时解决。
Most people can see the trend — but they enter at the wrong moment. Not because they don't understand direction, but because at the critical moment, they don't have an objective system telling them — now is the time. The Apex Pro Trading System · 巅峰交易系统, built by the Wealth Club quantitative analysis team, operates on a dual quantitative framework and automatically marks buy and sell signals at key structural price nodes — solving both trend judgment and entry timing simultaneously.
无需成为图表专家,强大的算法自动为你绘制所有关键信息。适用于股票、加密货币、外汇和商品等任何金融市场,支持1m、5m、15m、1h、4H、1D等所有主流时间框架。无论你是日内交易者、波段交易者还是趋势交易者,Apex Pro都能为你同时提供趋势方向和入场信号,让你像机构一样进行交易。
No need to be a chart expert. Our powerful algorithm automatically plots all key information for you. Compatible with any financial market — stocks, crypto, forex, and commodities — across all major timeframes including 1m, 5m, 15m, 1h, 4H, and 1D. Whether you're a day trader, swing trader, or trend trader, Apex Pro delivers both trend direction and entry signals simultaneously so you can trade like an institution.
这套系统做了什么?
What does this system do?
财富俱乐部量化分析团队通过以下四个维度构建这套系统:
深度量化研究公司财务数据
K线与趋势技术指标分析
机构主力资金流向监测
大数据与AI驱动的多因子模型
The Wealth Club quantitative analysis team built this system across four dimensions:
In-depth quantitative research of company financial data
Candlestick and trend technical indicator analysis
Institutional capital flow monitoring
Big data and AI-driven multi-factor model
在上述四个维度的基础上,Apex Pro系统额外整合了趋势持续性因子(Trend Persistence Factor)与多周期价格结构共振识别算法(Multi-Period Price Structure Resonance Detection)。前者源于机构量化研究中评估趋势生命周期的核心模型,用于判断当前趋势处于初期、中期还是衰竭阶段;后者同时扫描多个时间维度的价格结构节点,只有当多个维度在同一价格区域形成共振时,系统才触发买入或卖出信号——这正是机构级别信号识别的核心逻辑。
In addition to the four core dimensions, the Apex Pro system further integrates a Trend Persistence Factor and a Multi-Period Price Structure Resonance Detection Algorithm. The former is derived from institutional quantitative models used to assess trend lifecycle — identifying whether a trend is in its early, mid, or exhaustion phase. The latter simultaneously scans price structure nodes across multiple time dimensions — a signal is only triggered when multiple dimensions simultaneously form resonance at the same price zone. This is the core logic of institutional-grade signal identification.
Apex Pro在主图上同时运行两套独立的量化框架:MFI动能通道与SRB基准线。
Apex Pro runs two independent quantitative frameworks simultaneously on the main chart: the MFI Momentum Channel and the SRB Baseline.
MFI动能通道是系统的短期动能追踪核心,对市场方向变化高度敏感,率先捕捉趋势切换的早期信号。SRB基准线是系统的中长期趋势锚定框架,整合了机构级别的多周期趋势共振数据,只在市场结构发生实质性改变时才调整方向。当系统在多个时间维度的价格结构节点同时形成共振,自动在图表上标出蓝色BUY信号或粉红色SELL信号。
The MFI Momentum Channel is the system's short-term momentum tracking core — highly sensitive to directional shifts and the first to capture early trend transition signals. The SRB Baseline is the system's medium-to-long-term trend anchoring framework, integrating institutional-grade multi-period resonance data. It only adjusts when a genuine structural shift occurs. When the system detects simultaneous resonance across multiple time dimensions at key price structure nodes, it automatically marks a blue BUY signal or a pink SELL signal on the chart.
最终呈现在你面前的,只有两件事:图表上的BUY,和图表上的SELL。
What's presented to you is simple: BUY on the chart, and SELL on the chart.
🟢 MFI动能通道呈绿色 → 短期动能向上 → 上升趋势,买入信号
🟢 MFI Momentum Channel turns green → Upward momentum → Uptrend, buy signal
🔴 MFI动能通道呈红色 → 短期动能向下 → 下降趋势,卖出信号
🔴 MFI Momentum Channel turns red → Downward momentum → Downtrend, sell signal
🔵 SRB基准线呈蓝色 → 中长期趋势向上
🔵 SRB Baseline turns blue → Medium-to-long-term uptrend
🟣 SRB基准线呈深紫红色 → 中长期趋势向下
🟣 SRB Baseline turns deep purple-red → Medium-to-long-term downtrend
订阅后即可解锁Apex Pro完整使用指南,包括:
Subscribe to unlock the complete Apex Pro usage guide, including:
BUY信号出现后应该如何进场,SELL信号出现后应该如何阶段性锁利。
How to enter after a BUY signal appears and how to take staged profits after a SELL signal appears.
MFI动能通道与SRB基准线如何配合BUY/SELL信号使用,三套系统共振时的操作方法。
How to use the MFI Momentum Channel and SRB Baseline together with BUY/SELL signals — and how to act when all three elements resonate simultaneously.
哪个时间框架效果最好,日线、周线、小时线各有什么不同用法。
Which timeframe works best — how daily, weekly, and hourly charts each serve a different purpose.
如何避免假突破和假跌破,什么情况下信号应该忽略。
How to avoid false breakouts and false breakdowns, and when signals should be ignored.
如何配合Auto Support & Resistance Trading System · 智能支撑压力交易系统的支撑位与压力位,以及Sigma · 顶底捕捉交易系统或Zone · 热度预警交易系统共同确认,形成更高胜率的交易系统。
How to combine with the support and resistance levels from the Auto Support & Resistance Trading System · 智能支撑压力交易系统, and confirmation from the Sigma · Top & Bottom Detection Trading System or Zone · Heat Alert Trading System, to build a higher win-rate trading system.
如何在TradingView上获得这个指标的专属授权,直接在你自己的账户上实时使用。
How to obtain exclusive TradingView access to run this indicator live in your own account.
25 套量化交易信号系统 · 完整交易生态系统
25 Quantitative Trading Signal Systems · A Complete Trading Ecosystem
交易系统均基于AI机器学习量化模型持续优化,系统数量将随优化进程动态调整。
All trading systems are continuously optimized through AI-driven machine learning and quantitative modelling. The number of systems is subject to change as optimization evolves.
我们提供的,从来不只是一套买卖信号工具。
What we offer has never been just a set of buy and sell signals.
Wealth Club 构建的是一个完整的交易生态系统——25 套量化买卖信号交易系统、深度研究报告、交易机会报告、核心持仓名单、高潜力名单、市场简报、市场前瞻与投资学堂,七大模块有机结合,覆盖从宏观研判到精准入场的完整交易闭环。
Wealth Club is built around a complete trading ecosystem — 25 quantitative signal trading systems, deep research reports, trading opportunity reports, core watchlist, high-potential watchlist, market briefs, market outlook, and investment academy. Seven integrated modules covering everything from macro analysis to precise entry execution — a complete trading loop.
订阅会员可获得完整访问权限,包括:
Subscribing members receive full access to:
交易机会报告
深度研究报告
潜力名单
核心名单
25 套专业交易系统完整使用权
Trading opportunity reports
Deep research reports
Potential watchlist
Core watchlist
Full access to all 25 professional trading systems
👉 查看完整使用指南:https://www.thewealthclub.vip/trading-system-tong-apex-pro-trading-system/
👉 View Full Usage Guide: https://www.thewealthclub.vip/trading-system-tong-apex-pro-trading-system/
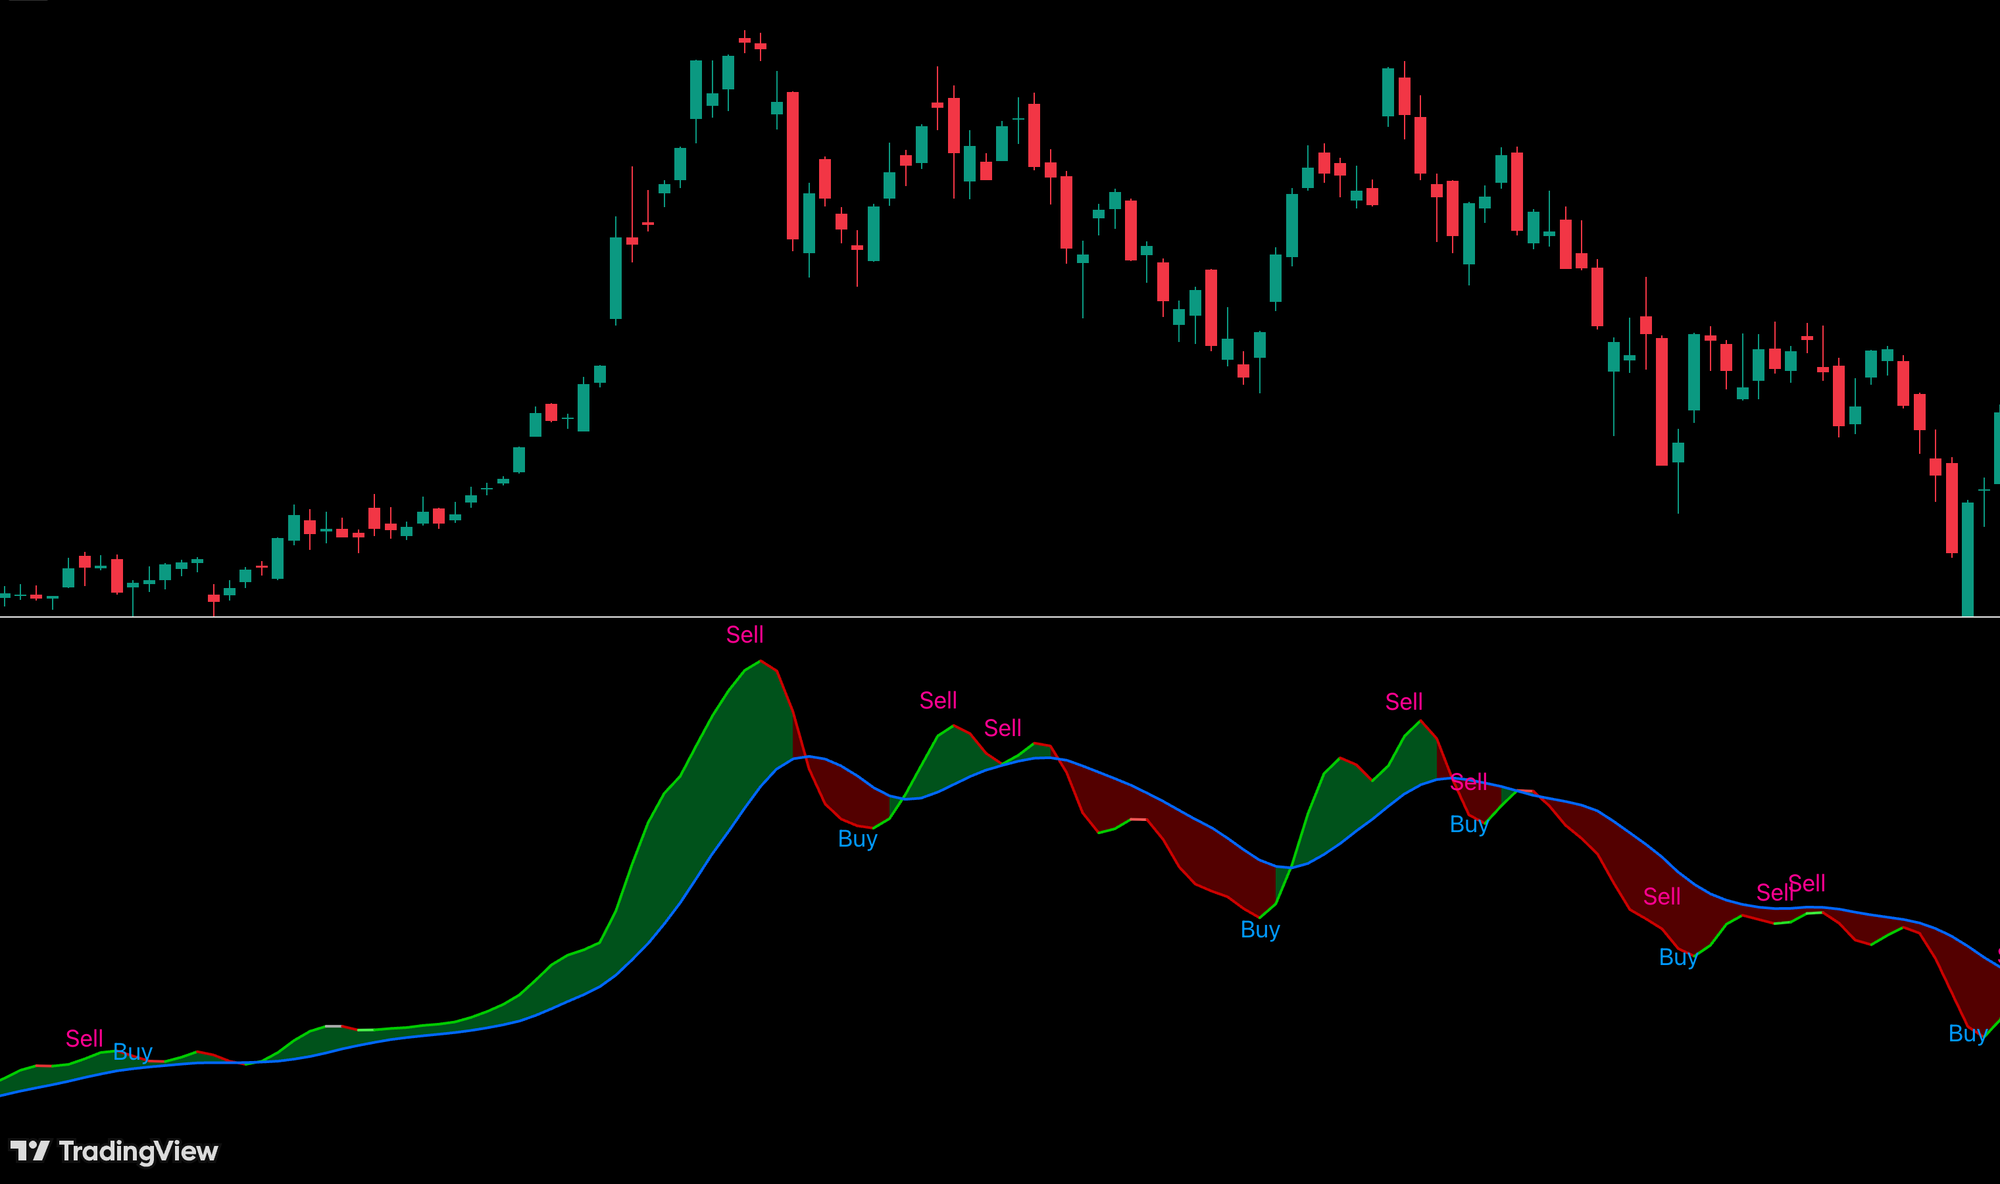
多空动能交易系统 · Force Trading System
【主图 · Main Chart】
实时量化多空双方力量对比,精准判断市场主导方向,在多空力量切换的关键时刻提前布局。
Quantifies the real-time balance of bullish and bearish forces, precisely determining the dominant market direction — positioning you ahead of every critical shift in market control.
市场里有两股力量在持续拉锯。看见它们的人,永远不会被趋势突袭。
Two forces are constantly pulling against each other in the market. Those who can see them will never be caught off guard by a trend.
趋势不是无缘无故出现的。在价格大幅移动之前,多空两方的力量对比早已发生了变化。Force Trading System · 多空动能交易系统由财富俱乐部量化分析团队打造,把多空两方的动能变化实时可视化——用两条轨道之间的填色空间,直接告诉你现在谁占优势,谁在退场。
Trends don't appear out of nowhere. Before price makes a big move, the balance of power between bulls and bears has already shifted. The Force Trading System · 多空动能交易系统, built by the Wealth Club quantitative analysis team, visualizes the dynamic changes in bull and bear momentum in real time — using the color-filled space between two tracks to tell you directly who has the advantage and who is retreating.
无需成为图表专家,强大的算法自动为你绘制所有关键信息。适用于股票、加密货币、外汇和商品等任何金融市场,支持1m、5m、15m、1h、4H、1D等所有主流时间框架。无论你是日内交易者、波段交易者还是趋势交易者,Force都能为你实时呈现多空力量消长,让你像机构一样进行交易。
No need to be a chart expert. Our powerful algorithm automatically plots all key information for you. Compatible with any financial market — stocks, crypto, forex, and commodities — across all major timeframes including 1m, 5m, 15m, 1h, 4H, and 1D. Whether you're a day trader, swing trader, or trend trader, Force presents the real-time bull-bear momentum shift so you can trade like an institution.
这套系统做了什么?
What does this system do?
财富俱乐部量化分析团队通过以下四个维度构建这套系统:
深度量化研究公司财务数据
K线与趋势技术指标分析
机构主力资金流向监测
大数据与AI驱动的多因子模型
The Wealth Club quantitative analysis team built this system across four dimensions:
In-depth quantitative research of company financial data
Candlestick and trend technical indicator analysis
Institutional capital flow monitoring
Big data and AI-driven multi-factor model
在上述四个维度的基础上,Force系统额外整合了趋势加速度模型(Trend Acceleration Model)与动能衰减预警指数(Momentum Decay Warning Index)。前者通过计算价格动能的一阶与二阶导数,精确衡量趋势推进的速度与加速度——这正是量化对冲基金在评估趋势强度时使用的核心数学框架;后者则在动能开始减速但尚未反转时率先给出预警,让你在趋势真正衰竭之前就做好风险管理准备。
In addition to the four core dimensions, the Force system further integrates a Trend Acceleration Model and a Momentum Decay Warning Index. The former calculates the first and second derivatives of price momentum to precisely measure the velocity and acceleration of trend progression — the core mathematical framework used by quantitative hedge funds when assessing trend strength. The latter issues an early warning when momentum begins decelerating but has not yet reversed, giving you time to manage risk before the trend fully exhausts.
Force在副图上显示两条量化动态轨道,轨道之间的空间用颜色填充。当多头动能占优,填色空间变为绿色,轨道向上扩展,系统自动标出BUY信号;当空头动能接管,填色空间转为红色,轨道向下收窄,系统自动标出SELL信号。
Force displays two quantitative dynamic tracks on the sub-chart, with the space between them filled with color. When bullish momentum dominates, the fill turns green and the tracks expand upward — the system automatically marks a BUY signal. When bearish momentum takes over, the fill turns red and the tracks contract downward — the system marks a SELL signal.
最终呈现在你面前的,只有两件事:图表上的BUY,和图表上的SELL。
What's presented to you is simple: BUY on the chart, and SELL on the chart.
订阅后即可解锁Force完整使用指南,包括:
Subscribe to unlock the complete Force usage guide, including:
填色空间转色时的具体进场和离场操作。
Exactly how to enter and exit when the color fill changes.
哪个时间周期效果最好,日线、周线、小时线各有什么不同用法。
Which timeframe works best — how daily, weekly, and hourly charts each serve a different purpose.
如何判断填色空间的扩大和收窄,代表完全不同的市场信号。
How to judge the expansion and contraction of the color fill — they represent completely different market signals.
如何配合Auto Support & Resistance Trading System · 智能支撑压力交易系统的支撑位与压力位,以及Sigma · 顶底捕捉交易系统或Zone · 热度预警交易系统共同确认,形成更高胜率的交易系统。
How to combine with the support and resistance levels from the Auto Support & Resistance Trading System · 智能支撑压力交易系统, and confirmation from the Sigma · Top & Bottom Detection Trading System or Zone · Heat Alert Trading System, to build a higher win-rate trading system.
如何在TradingView上获得这个指标的专属授权,直接在你自己的账户上实时使用。
How to obtain exclusive TradingView access to run this indicator live in your own account.
25 套量化交易信号系统 · 完整交易生态系统
25 Quantitative Trading Signal Systems · A Complete Trading Ecosystem
交易系统均基于AI机器学习量化模型持续优化,系统数量将随优化进程动态调整。
All trading systems are continuously optimized through AI-driven machine learning and quantitative modelling. The number of systems is subject to change as optimization evolves.
我们提供的,从来不只是一套买卖信号工具。
What we offer has never been just a set of buy and sell signals.
Wealth Club 构建的是一个完整的交易生态系统——25 套量化买卖信号交易系统、深度研究报告、交易机会报告、核心持仓名单、高潜力名单、市场简报、市场前瞻与投资学堂,七大模块有机结合,覆盖从宏观研判到精准入场的完整交易闭环。
Wealth Club is built around a complete trading ecosystem — 25 quantitative signal trading systems, deep research reports, trading opportunity reports, core watchlist, high-potential watchlist, market briefs, market outlook, and investment academy. Seven integrated modules covering everything from macro analysis to precise entry execution — a complete trading loop.
订阅会员可获得完整访问权限,包括:
Subscribing members receive full access to:
交易机会报告
深度研究报告
潜力名单
核心名单
25 套专业交易系统完整使用权
Trading opportunity reports
Deep research reports
Potential watchlist
Core watchlist
Full access to all 25 professional trading systems
👉 查看完整使用指南:https://www.thewealthclub.vip/trading-system-force-trading-system/
👉 View Full Usage Guide: https://www.thewealthclub.vip/trading-system-force-trading-system/
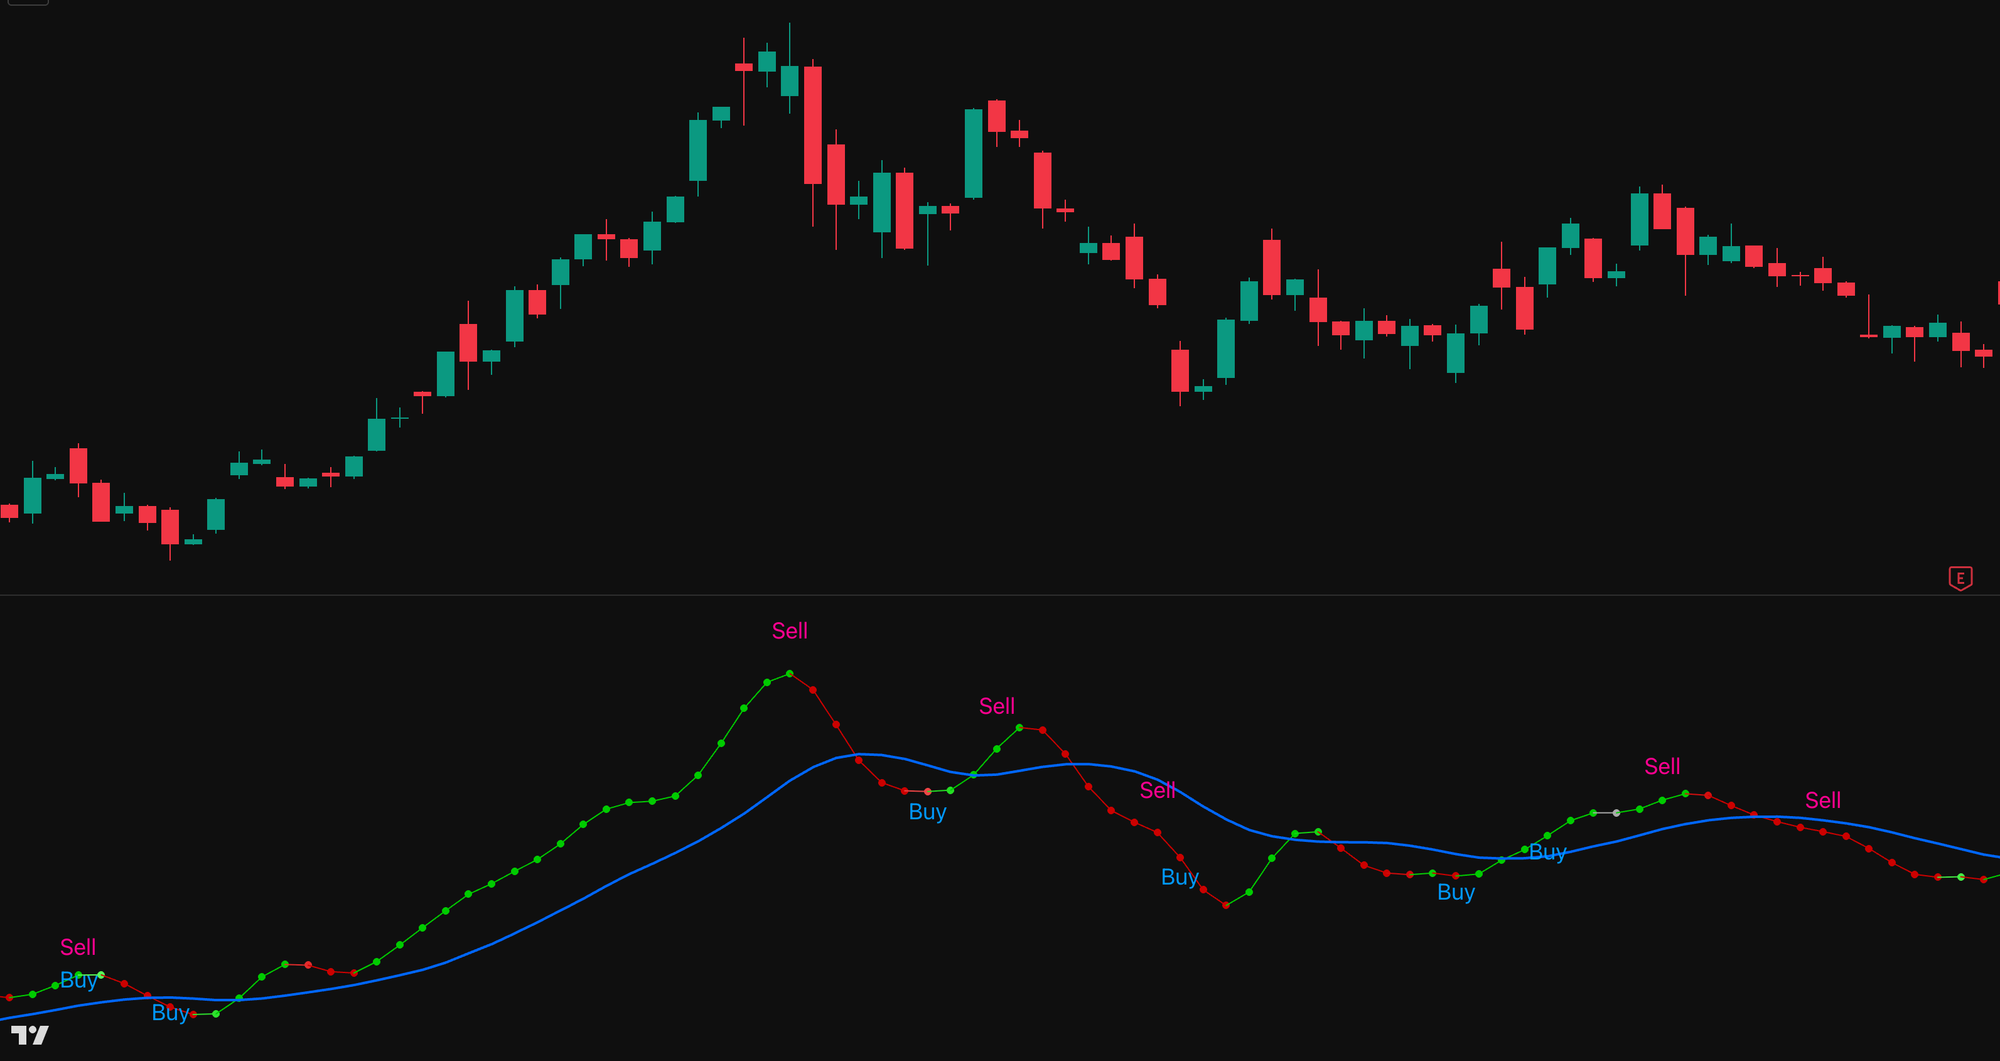
点位信号系统 · Dot Trading System
【主图 · Main Chart】
以精准点位直接标注最优入场与出场位置,简单直观,让每一个交易决策一目了然。
Directly marks the optimal entry and exit points with precision dots — simple, intuitive, and making every trading decision instantly clear at a glance.
每一个点,都是市场动能留下的印记。
Every dot is a mark left behind by market momentum.
市场的动能不是线性的——它在每一根K线上都有强弱之分,有方向之别。Dot Trading System · 点位信号交易系统由财富俱乐部量化分析团队打造,用一串有颜色、有深浅、有连接的圆点,把市场动能的每一次变化清晰呈现——绿点代表上涨动能,红点代表下跌动能,点与点之间用同色线段连接,让轨迹连续可读,让每一个转折点一目了然。
Market momentum is not linear — it has varying strength and direction at every candlestick. The Dot Trading System · 点位信号交易系统, built by the Wealth Club quantitative analysis team, uses a series of colored, depth-graded, connected dots to clearly present every shift in market momentum — green dots indicate upward momentum, red dots indicate downward momentum, and dots are connected by same-colored line segments, making the trail continuously readable and every turning point immediately visible.
无需成为图表专家,强大的算法自动为你绘制所有关键信息。适用于股票、加密货币、外汇和商品等任何金融市场,支持1m、5m、15m、1h、4H、1D等所有主流时间框架。无论你是日内交易者、波段交易者还是趋势交易者,Dot都能为你实时呈现市场动能的方向和强度,让你像机构一样进行交易。
No need to be a chart expert. Our powerful algorithm automatically plots all key information for you. Compatible with any financial market — stocks, crypto, forex, and commodities — across all major timeframes including 1m, 5m, 15m, 1h, 4H, and 1D. Whether you're a day trader, swing trader, or trend trader, Dot presents the direction and strength of market momentum in real time so you can trade like an institution.
这套系统做了什么?
What does this system do?
财富俱乐部量化分析团队通过以下四个维度构建这套系统:
深度量化研究公司财务数据
K线与趋势技术指标分析
机构主力资金流向监测
大数据与AI驱动的多因子模型
The Wealth Club quantitative analysis team built this system across four dimensions:
In-depth quantitative research of company financial data
Candlestick and trend technical indicator analysis
Institutional capital flow monitoring
Big data and AI-driven multi-factor model
在上述四个维度的基础上,Dot系统额外整合了动能加速度评分(Momentum Acceleration Score)与价格结构线性回归模型(Price Structure Linear Regression)。前者通过量化动能在单位时间内的变化速率,精确识别动能正在加速还是减速——颜色深浅直接反映加速度的强弱;后者则通过机构级别的线性回归算法对价格结构进行平滑处理,过滤短期噪音,让圆点的颜色变化只反映真正有意义的动能切换。
In addition to the four core dimensions, the Dot system further integrates a Momentum Acceleration Score and a Price Structure Linear Regression Model. The former quantifies the rate of change of momentum over time, precisely identifying whether momentum is accelerating or decelerating — the depth of color directly reflects the strength of acceleration. The latter applies institutional-grade linear regression to smooth price structure, filtering short-term noise so that color changes in the dots only reflect genuinely meaningful momentum shifts.
Dot在副图上显示两个核心元素。圆点序列追踪短期价格动能——绿色圆点代表上涨动能,颜色越深动能越强;红色圆点代表下跌动能,颜色越深下跌越有力;圆点之间用同色线段连接,让动能的轨迹连续清晰。蓝色基准线追踪中长期趋势的主方向,走势平稳,为圆点序列提供方向参考。
Dot displays two core elements on the sub-chart. The dot sequence tracks short-term price momentum — green dots indicate upward momentum with deeper green meaning stronger force; red dots indicate downward momentum with deeper red meaning stronger selling pressure; dots are connected by same-colored line segments, making the momentum trail continuous and clear. The blue baseline tracks the primary medium-to-long-term trend direction with steady movement, providing directional context for the dot sequence.
最终呈现在你面前的,只有两件事:圆点的颜色,和基准线的方向。
What's presented to you is simple: the color of the dots, and the direction of the baseline.
🟢 绿色圆点 → 上涨动能,买入机会
🟢 Green dots → Upward momentum, buy opportunity
🔴 红色圆点 → 下跌动能,卖出机会
🔴 Red dots → Downward momentum, sell opportunity
订阅后即可解锁Dot完整使用指南,包括:
Subscribe to unlock the complete Dot usage guide, including:
圆点颜色深浅的具体含义,深色和浅色代表完全不同的市场状态。
The specific meaning of dot color depth — deep and light colors represent completely different market states.
圆点序列与蓝色基准线的位置关系如何判断趋势强弱。
How the position relationship between the dot sequence and the blue baseline indicates trend strength.
哪个时间周期效果最好,日线、周线、小时线各有什么不同用法。
Which timeframe works best — how daily, weekly, and hourly charts each serve a different purpose.
如何配合Auto Support & Resistance Trading System · 智能支撑压力交易系统的支撑位与压力位,以及Sigma · 顶底捕捉交易系统或Zone · 热度预警交易系统共同确认,形成更高胜率的交易系统。
How to combine with the support and resistance levels from the Auto Support & Resistance Trading System · 智能支撑压力交易系统, and confirmation from the Sigma · Top & Bottom Detection Trading System or Zone · Heat Alert Trading System, to build a higher win-rate trading system.
如何在TradingView上获得这个指标的专属授权,直接在你自己的账户上实时使用。
How to obtain exclusive TradingView access to run this indicator live in your own account.
25 套量化交易信号系统 · 完整交易生态系统
25 Quantitative Trading Signal Systems · A Complete Trading Ecosystem
交易系统均基于AI机器学习量化模型持续优化,系统数量将随优化进程动态调整。
All trading systems are continuously optimized through AI-driven machine learning and quantitative modelling. The number of systems is subject to change as optimization evolves.
我们提供的,从来不只是一套买卖信号工具。
What we offer has never been just a set of buy and sell signals.
Wealth Club 构建的是一个完整的交易生态系统——25 套量化买卖信号交易系统、深度研究报告、交易机会报告、核心持仓名单、高潜力名单、市场简报、市场前瞻与投资学堂,七大模块有机结合,覆盖从宏观研判到精准入场的完整交易闭环。
Wealth Club is built around a complete trading ecosystem — 25 quantitative signal trading systems, deep research reports, trading opportunity reports, core watchlist, high-potential watchlist, market briefs, market outlook, and investment academy. Seven integrated modules covering everything from macro analysis to precise entry execution — a complete trading loop.
订阅会员可获得完整访问权限,包括:
Subscribing members receive full access to:
交易机会报告
深度研究报告
潜力名单
核心名单
25 套专业交易系统完整使用权
Trading opportunity reports
Deep research reports
Potential watchlist
Core watchlist
Full access to all 25 professional trading systems
👉 查看完整使用指南:https://www.thewealthclub.vip/trading-system-dot-trading-system/
👉 View Full Usage Guide: https://www.thewealthclub.vip/trading-system-dot-trading-system/
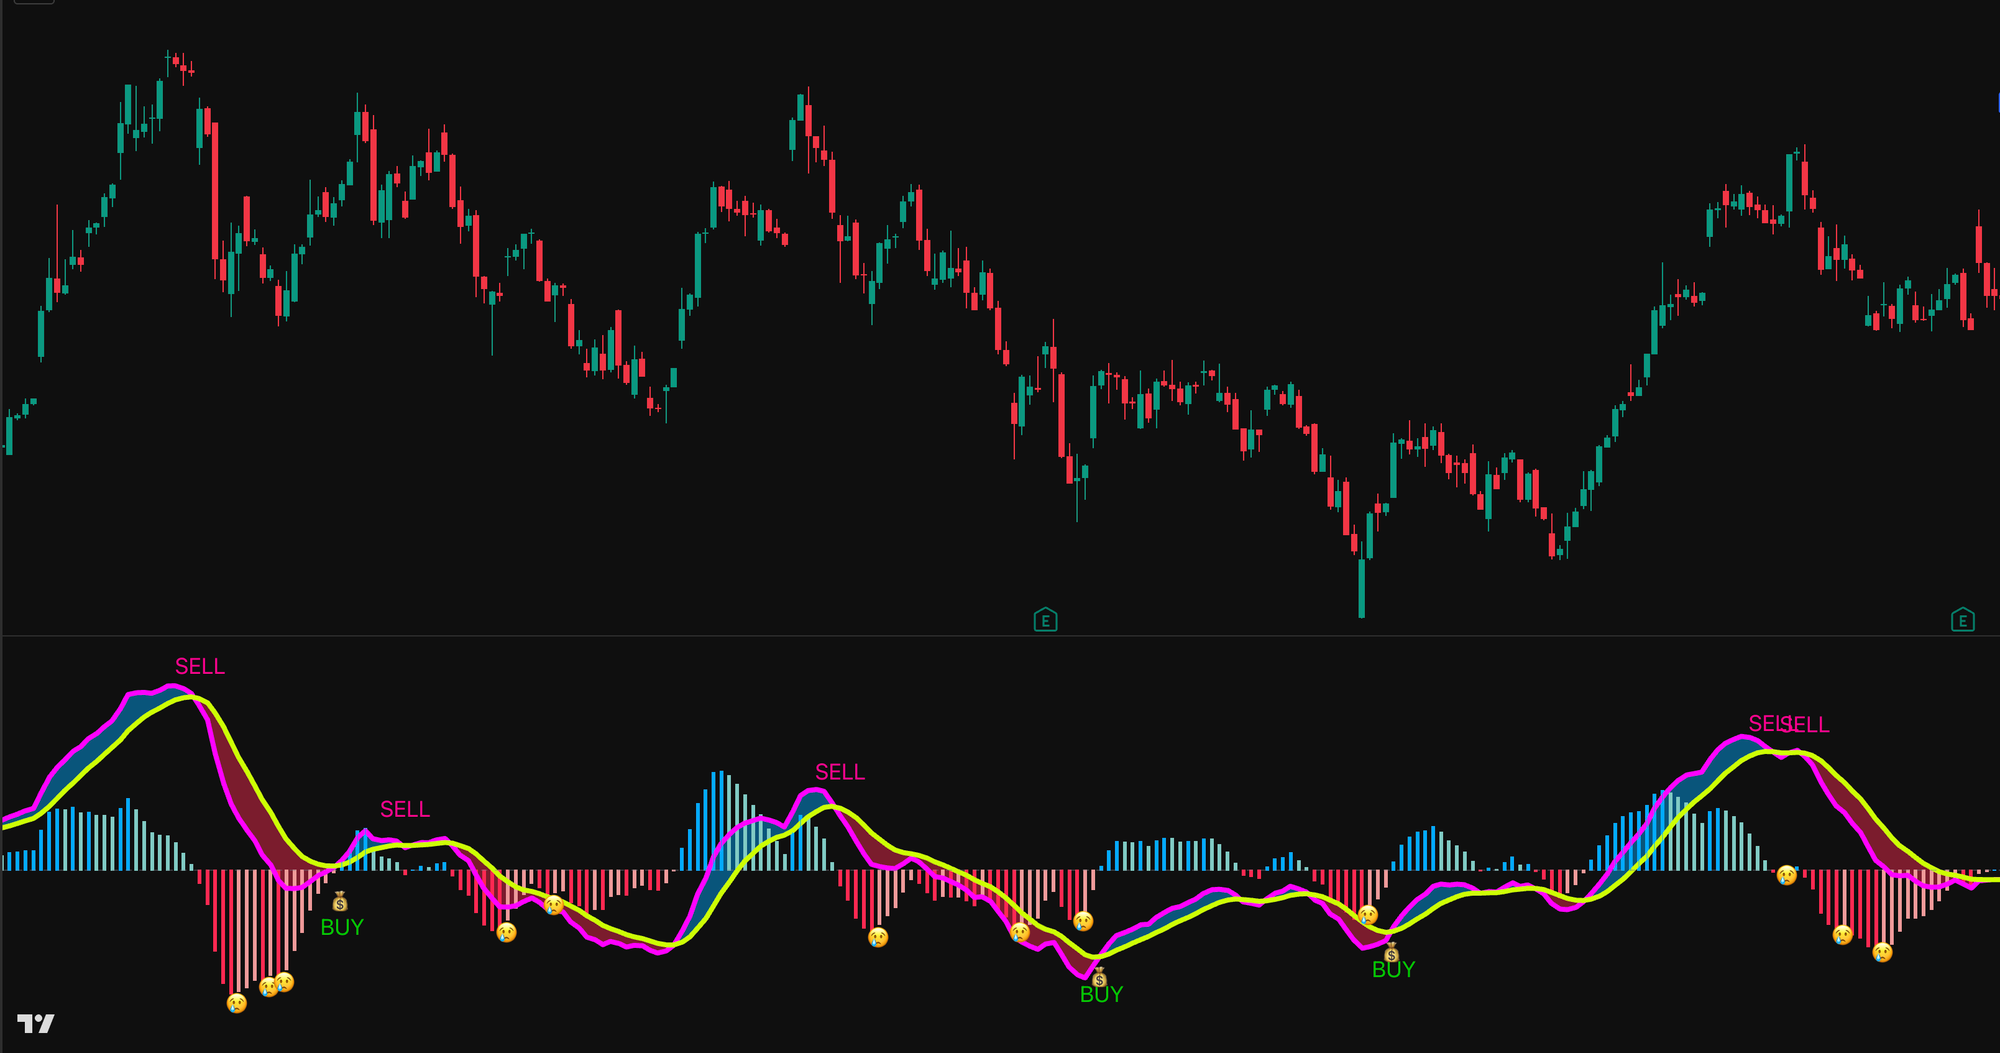
多空对决交易系统 · Duel Trading System
【主图 · Main Chart】
实时呈现多空双方的激烈博弈,清晰量化买卖双方力量消长,在多空格局明朗之际精准捕捉交易方向。
Visualizes the intense battle between bulls and bears in real time, clearly quantifying the shifting balance of buying and selling pressure — capturing the precise trading direction the moment the market balance tips.
市场每一天都在进行一场战争。多头和空头,谁占上风,决定了价格的方向。
Every day in the market is a battle. Bulls versus bears — whoever wins determines the direction of price.
大多数散户看不见这场战争的过程,只能看见结果。等他们意识到方向的时候,最好的入场时机往往已经过去。Duel Trading System · 多空对决交易系统由财富俱乐部量化分析团队打造,把多空双方的力量对比实时可视化——让你在趋势形成之前,看见战局的走向。
Most retail traders can't see the battle as it unfolds — they only see the result. By the time they recognize the direction, the best entry opportunity has usually passed. The Duel Trading System · 多空对决交易系统, built by the Wealth Club quantitative analysis team, visualizes the real-time balance of power between bulls and bears — letting you see which way the battle is turning before the trend fully forms.
无需成为图表专家,强大的算法自动为你绘制所有关键信息。适用于股票、加密货币、外汇和商品等任何金融市场,支持1m、5m、15m、1h、4H、1D等所有主流时间框架。无论你是日内交易者、波段交易者还是趋势交易者,Duel都能为你实时呈现多空力量对比,让你像机构一样进行交易。
No need to be a chart expert. Our powerful algorithm automatically plots all key information for you. Compatible with any financial market — stocks, crypto, forex, and commodities — across all major timeframes including 1m, 5m, 15m, 1h, 4H, and 1D. Whether you're a day trader, swing trader, or trend trader, Duel presents the real-time bull-bear balance so you can trade like an institution.
这套系统做了什么?
What does this system do?
财富俱乐部量化分析团队通过以下四个维度构建这套系统:
深度量化研究公司财务数据
K线与趋势技术指标分析
机构主力资金流向监测
大数据与AI驱动的多因子模型
The Wealth Club quantitative analysis team built this system across four dimensions:
In-depth quantitative research of company financial data
Candlestick and trend technical indicator analysis
Institutional capital flow monitoring
Big data and AI-driven multi-factor model
在上述四个维度的基础上,Duel系统额外整合了多空力量实时对比值(Real-Time Long/Short Power Ratio)与暗池机构订单流侦测模型(Dark Pool Institutional Order Flow Detection)。前者通过量化多空双方的持仓成本、换手速度和资金体量,实时计算多空力量对比;后者则借鉴机构级暗池数据分析方法,侦测大宗机构订单在市场中留下的"足迹",在控场方发生切换前提前给出预警信号。
In addition to the four core dimensions, the Duel system further integrates a Real-Time Long/Short Power Ratio and a Dark Pool Institutional Order Flow Detection Model. The former quantifies the cost basis, turnover velocity, and capital scale of both long and short sides to calculate their real-time power balance. The latter draws on institutional dark pool data analysis methodology to detect the "footprints" left by large block orders in the market, issuing an early warning signal before the dominant side shifts.
Duel在副图上同时显示两条量化动态轨道和彩色柱状图。当多头占优,两条轨道之间的区域转为蓝色,柱状图同步呈现蓝色,代表趋势进入上升通道,系统自动标出BUY信号;当空头接管,两条轨道之间的区域转为红色,柱状图同步转为红色,代表趋势反转向下,系统自动标出SELL信号。两条轨道的交叉点,就是多空力量转换的关键时刻。
Duel displays two quantitative dynamic tracks and a color histogram simultaneously on the sub-chart. When bulls dominate, the zone between the two tracks turns blue and the histogram shifts to blue in sync — and the system automatically marks a BUY signal. When bears take over, the zone turns red and the histogram shifts to red, and the system automatically marks a SELL signal. The crossover point of the two tracks is the critical moment when the balance of power shifts.
最终呈现在你面前的,只有两件事:图表上的BUY,和图表上的SELL。
What's presented to you is simple: BUY on the chart, and SELL on the chart.
🔵 蓝色通道 → 多头占优,买入机会
🔵 Blue zone → Bulls in control, buy opportunity
🔴 红色通道 → 空头接管,卖出机会
🔴 Red zone → Bears in control, sell opportunity
订阅后即可解锁Duel完整使用指南,包括:
Subscribe to unlock the complete Duel usage guide, including:
两条轨道交叉时的具体进场和离场操作。
Exactly how to enter and exit when the two tracks cross.
哪个时间周期效果最好,日线、周线、小时线各有什么不同用法。
Which timeframe works best — how daily, weekly, and hourly charts each serve a different purpose.
如何判断柱状图和轨道的共振,强信号和弱信号的区别。
How to judge the resonance between the histogram and the tracks — the difference between strong and weak signals.
如何配合Auto Support & Resistance Trading System · 智能支撑压力交易系统的支撑位与压力位,以及Sigma · 顶底捕捉交易系统或Zone · 热度预警交易系统共同确认,形成更高胜率的交易系统。
How to combine with the support and resistance levels from the Auto Support & Resistance Trading System · 智能支撑压力交易系统, and confirmation from the Sigma · Top & Bottom Detection Trading System or Zone · Heat Alert Trading System, to build a higher win-rate trading system.
如何在TradingView上获得这个指标的专属授权,直接在你自己的账户上实时使用。
How to obtain exclusive TradingView access to run this indicator live in your own account.
25 套量化交易信号系统 · 完整交易生态系统
25 Quantitative Trading Signal Systems · A Complete Trading Ecosystem
交易系统均基于AI机器学习量化模型持续优化,系统数量将随优化进程动态调整。
All trading systems are continuously optimized through AI-driven machine learning and quantitative modelling. The number of systems is subject to change as optimization evolves.
我们提供的,从来不只是一套买卖信号工具。
What we offer has never been just a set of buy and sell signals.
Wealth Club 构建的是一个完整的交易生态系统——25 套量化买卖信号交易系统、深度研究报告、交易机会报告、核心持仓名单、高潜力名单、市场简报、市场前瞻与投资学堂,七大模块有机结合,覆盖从宏观研判到精准入场的完整交易闭环。
Wealth Club is built around a complete trading ecosystem — 25 quantitative signal trading systems, deep research reports, trading opportunity reports, core watchlist, high-potential watchlist, market briefs, market outlook, and investment academy. Seven integrated modules covering everything from macro analysis to precise entry execution — a complete trading loop.
订阅会员可获得完整访问权限,包括:
Subscribing members receive full access to:
交易机会报告
深度研究报告
潜力名单
核心名单
25 套专业交易系统完整使用权
Trading opportunity reports
Deep research reports
Potential watchlist
Core watchlist
Full access to all 25 professional trading systems
👉 查看完整使用指南:https://www.thewealthclub.vip/trading-system-duel-trading-system/
👉 View Full Usage Guide: https://www.thewealthclub.vip/trading-system-duel-trading-system/
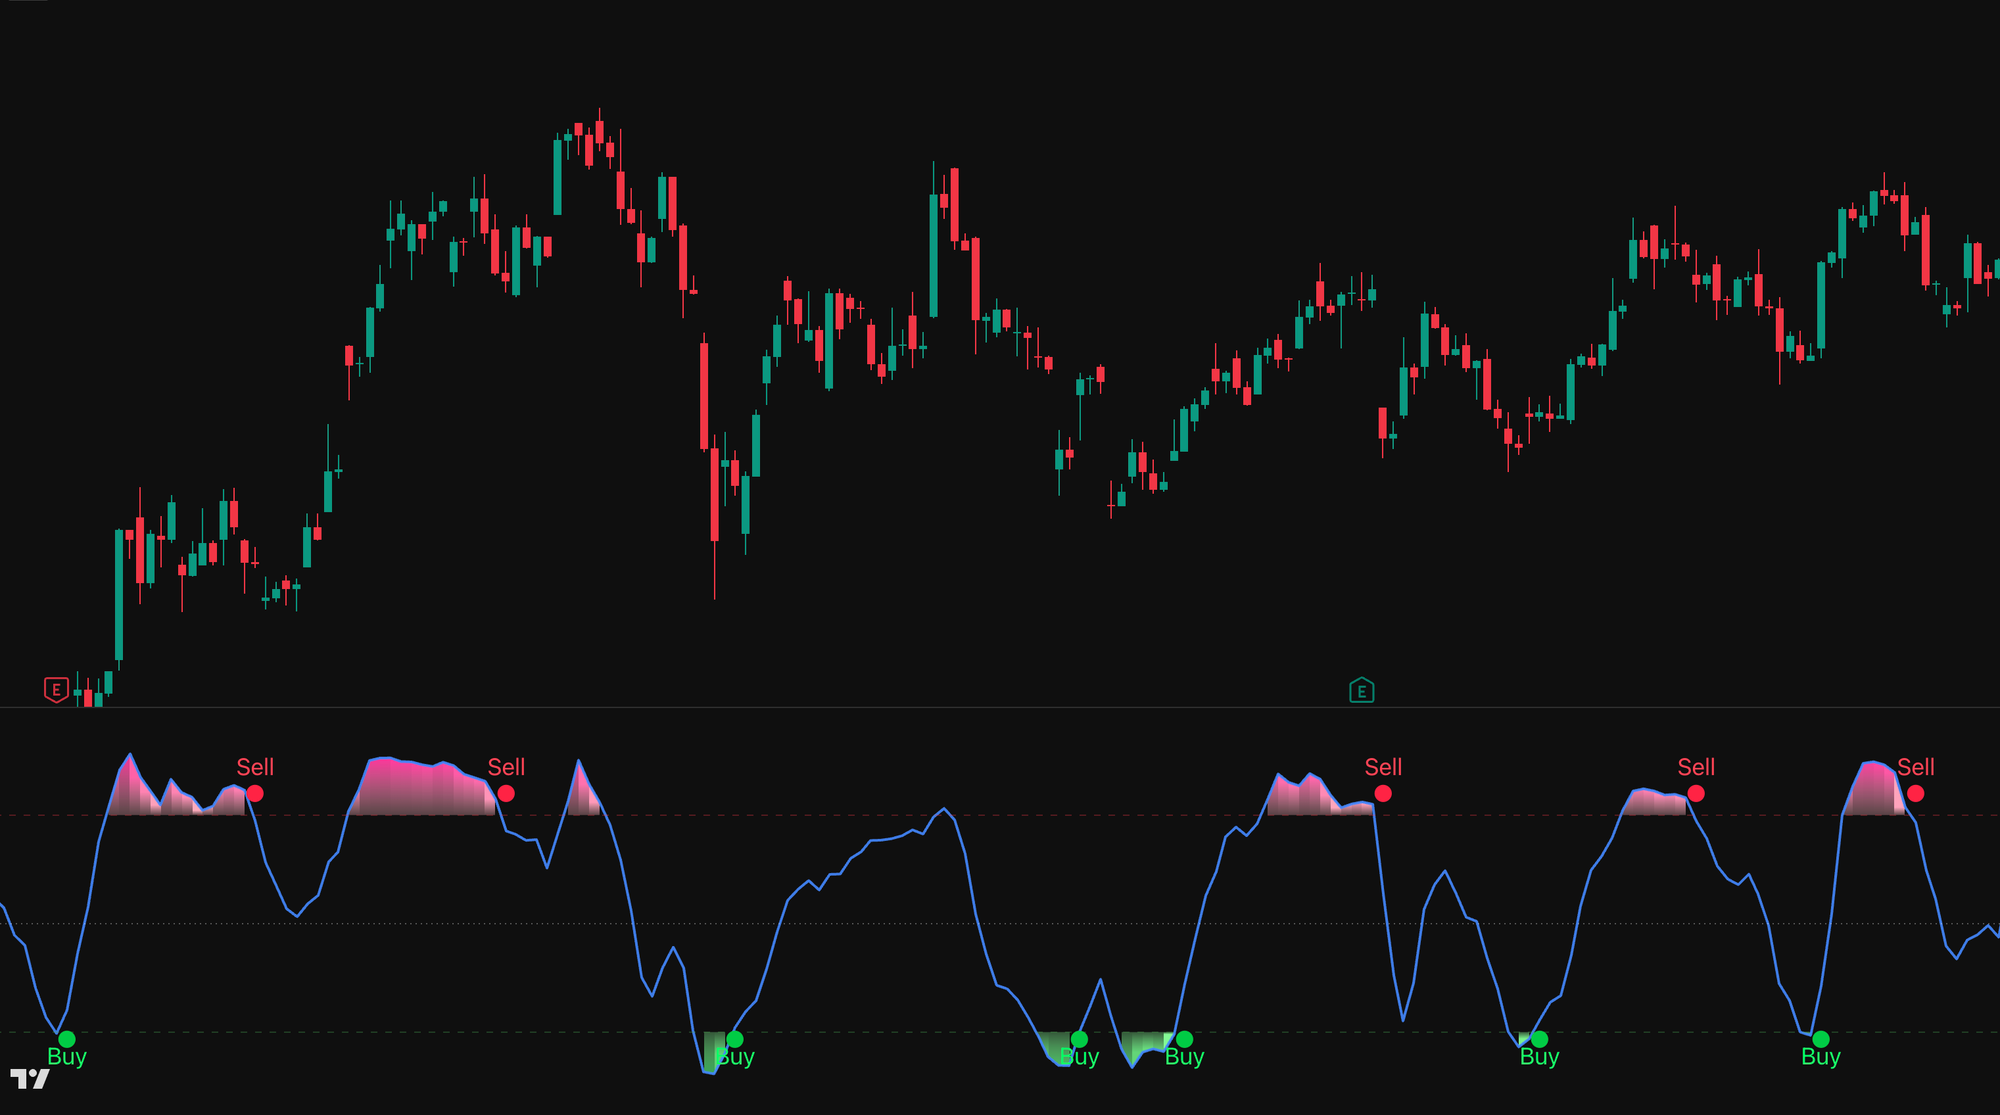
顶底捕捉交易系统 · Sigma Trading System
【主图 · Main Chart】
运用统计学原理精准识别价格偏离极值区域,在市场超买超卖的极端位置发出顶底信号,捕捉最高性价比的反转入场机会。
Applies statistical principles to precisely identify extreme price deviation zones, generating top and bottom signals at overbought and oversold extremes — capturing the highest value reversal entry opportunities in the market.
市场的顶和底,永远是最难判断、也是最值钱的两个位置。
The top and the bottom of the market are always the hardest to identify — and the most valuable.
追涨杀跌是散户最常见的亏损模式。涨了一大段才买进,跌了一大段才止损。不是因为不够努力,而是因为没有一套系统能在关键转折点提前告诉你——这里,已经到极限了。Sigma Trading System · 顶底捕捉交易系统由财富俱乐部量化分析团队打造,专门解决这一个问题——在市场到达极度超买或极度超卖区间时,系统自动发出信号。
Chasing rallies and panic-selling are the most common loss patterns among retail traders. Buying after a big run-up, selling after a big drop. Not because they don't try hard enough, but because they don't have a system that tells them at the critical turning point — this is the limit. The Sigma Trading System · 顶底捕捉交易系统, built by the Wealth Club quantitative analysis team, is designed to solve exactly this — when the market reaches extreme overbought or oversold territory, the system automatically signals.
无需成为图表专家,强大的算法自动为你绘制所有关键信息。适用于股票、加密货币、外汇和商品等任何金融市场,支持1m、5m、15m、1h、4H、1D等所有主流时间框架。无论你是日内交易者、波段交易者还是趋势交易者,Sigma都能为你精准捕捉市场的顶部和底部信号,让你像机构一样进行交易。
No need to be a chart expert. Our powerful algorithm automatically plots all key information for you. Compatible with any financial market — stocks, crypto, forex, and commodities — across all major timeframes including 1m, 5m, 15m, 1h, 4H, and 1D. Whether you're a day trader, swing trader, or trend trader, Sigma precisely captures market top and bottom signals so you can trade like an institution.
这套系统做了什么?
What does this system do?
财富俱乐部量化分析团队通过以下四个维度构建这套系统:
深度量化研究公司财务数据
K线与趋势技术指标分析
机构主力资金流向监测
大数据与AI驱动的多因子模型
The Wealth Club quantitative analysis team built this system across four dimensions:
In-depth quantitative research of company financial data
Candlestick and trend technical indicator analysis
Institutional capital flow monitoring
Big data and AI-driven multi-factor model
在上述四个维度的基础上,Sigma系统额外整合了统计标准差极值模型(Statistical Standard Deviation Extremes)与超买超卖临界值动态校准(Dynamic Overbought/Oversold Threshold Calibration)。前者直接借鉴自机构风险管理中的VaR(在险价值)统计框架,通过计算价格偏离历史均值的标准差倍数,精确锁定市场处于统计意义上的极端区域;后者则根据不同市场环境动态调整阈值,避免在高波动率周期中产生大量假信号。
In addition to the four core dimensions, the Sigma system further integrates a Statistical Standard Deviation Extremes Model and Dynamic Overbought/Oversold Threshold Calibration. The former draws directly from the VaR (Value at Risk) statistical framework used in institutional risk management, precisely identifying when price has reached statistically extreme territory by calculating standard deviation multiples from historical mean. The latter dynamically adjusts thresholds based on prevailing market conditions, reducing false signals during high-volatility regimes.
Sigma在副图上实时追踪市场的超买超卖状态。当市场进入极度超买区间,副图顶部出现粉红色渐变填充区,代表风险正在累积;当蓝色主线从超买区顶部回落穿越超买线,系统自动标出Sell信号。当市场跌入极度超卖区间,副图底部出现绿色渐变填充区,代表机会正在积累;当蓝色主线从超卖区底部回升穿越超卖线,系统自动标出Buy信号。颜色告诉你风险在哪里,信号告诉你时机在哪里。
Sigma tracks the market's overbought and oversold conditions in real time on the sub-chart. When the market enters extreme overbought territory, a pink gradient fill appears at the top of the sub-chart, signaling accumulating risk. When the blue main line retreats and crosses back below the overbought line, the system automatically marks a Sell signal. When the market falls into extreme oversold territory, a green gradient fill appears at the bottom, signaling accumulating opportunity. When the blue main line recovers and crosses back above the oversold line, the system automatically marks a Buy signal. Color tells you where the risk is. The signal tells you when the timing is right.
最终呈现在你面前的,只有两件事:图表上的BUY,和图表上的SELL。
What's presented to you is simple: BUY on the chart, and SELL on the chart.
🩷 粉红色渐变填充 → 超买区间,风险累积,注意卖出信号
🩷 Pink gradient fill → Overbought zone, risk accumulating, watch for Sell signal
🟢 绿色渐变填充 → 超卖区间,机会累积,留意买入信号
🟢 Green gradient fill → Oversold zone, opportunity accumulating, watch for Buy signal
订阅后即可解锁Sigma完整使用指南,包括:
Subscribe to unlock the complete Sigma usage guide, including:
粉红色填充区出现时的具体操作——应该立刻减仓还是等待Sell信号确认。
Exactly what to do when the pink overlay appears — reduce position immediately or wait for Sell signal confirmation.
哪个时间周期效果最好,日线、周线、小时线各有什么不同用法。
Which timeframe works best — how daily, weekly, and hourly charts each serve a different purpose.
如何避免假突破和假跌破,什么情况下信号应该忽略。
How to avoid false breakouts and false breakdowns, and when signals should be ignored.
如何配合Auto Support & Resistance Trading System · 智能支撑压力交易系统的支撑位与压力位,以及主图系统共同确认,形成更高胜率的交易系统。
How to combine with the support and resistance levels from the Auto Support & Resistance Trading System · 智能支撑压力交易系统, and main-chart system confirmation, to build a higher win-rate trading system.
如何在TradingView上获得这个指标的专属授权,直接在你自己的账户上实时使用。
How to obtain exclusive TradingView access to run this indicator live in your own account.
25 套量化交易信号系统 · 完整交易生态系统
25 Quantitative Trading Signal Systems · A Complete Trading Ecosystem
交易系统均基于AI机器学习量化模型持续优化,系统数量将随优化进程动态调整。
All trading systems are continuously optimized through AI-driven machine learning and quantitative modelling. The number of systems is subject to change as optimization evolves.
我们提供的,从来不只是一套买卖信号工具。
What we offer has never been just a set of buy and sell signals.
Wealth Club 构建的是一个完整的交易生态系统——25 套量化买卖信号交易系统、深度研究报告、交易机会报告、核心持仓名单、高潜力名单、市场简报、市场前瞻与投资学堂,七大模块有机结合,覆盖从宏观研判到精准入场的完整交易闭环。
Wealth Club is built around a complete trading ecosystem — 25 quantitative signal trading systems, deep research reports, trading opportunity reports, core watchlist, high-potential watchlist, market briefs, market outlook, and investment academy. Seven integrated modules covering everything from macro analysis to precise entry execution — a complete trading loop.
订阅会员可获得完整访问权限,包括:
Subscribing members receive full access to:
交易机会报告
深度研究报告
潜力名单
核心名单
25 套专业交易系统完整使用权
Trading opportunity reports
Deep research reports
Potential watchlist
Core watchlist
Full access to all 25 professional trading systems
👉 查看完整使用指南:https://www.thewealthclub.vip/trading-system-sigma-trading-system/
👉 View Full Usage Guide: https://www.thewealthclub.vip/trading-system-sigma-trading-system/
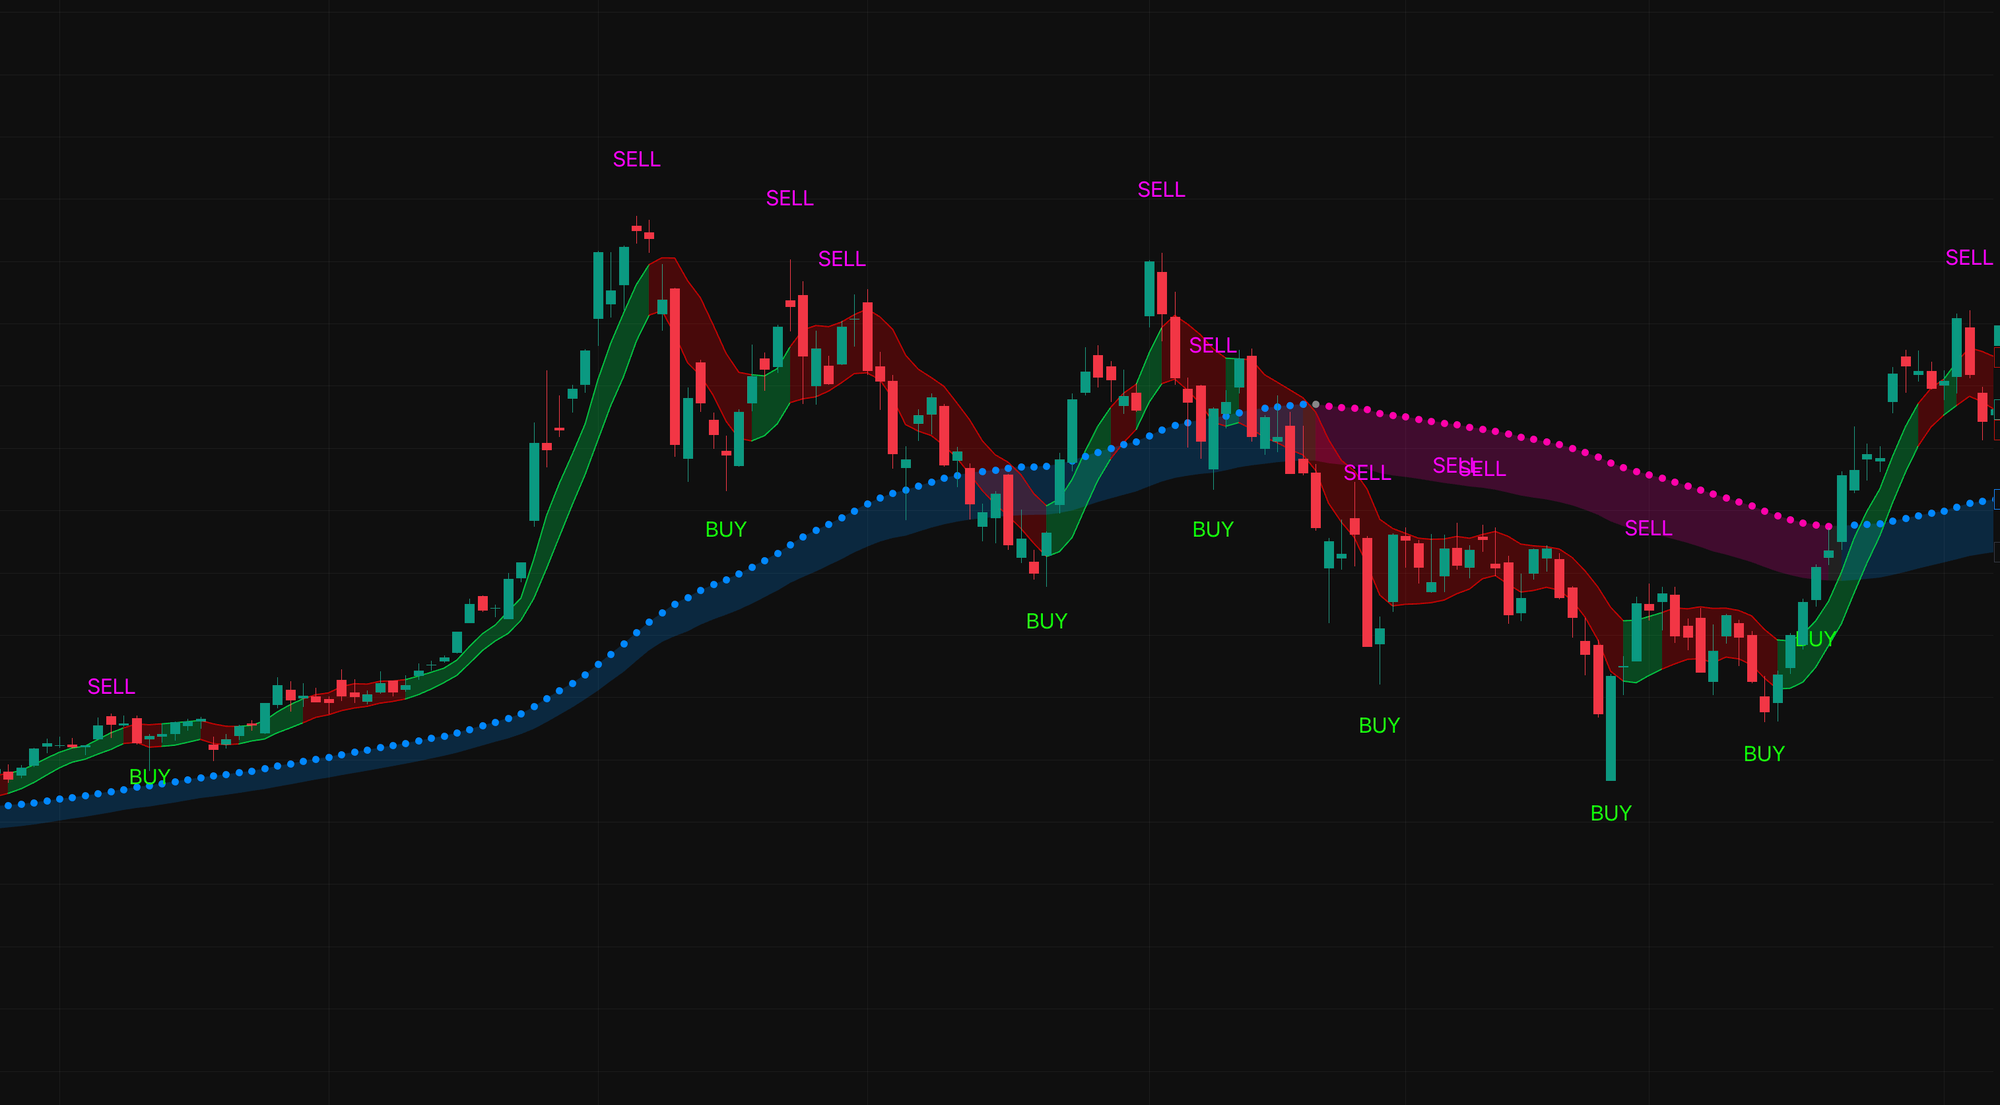
共振进阶交易系统 · Confluence Pro Trading System
【主图 · Main Chart】
在共振交易系统的基础上进一步升级,融合更多维度的技术因子共振验证,以更严格的信号筛选机制大幅提升交易精准度与胜率。
Building on the foundation of the Confluence Trading System with a significant upgrade — integrating multi-dimensional technical factor confluence verification and a more rigorous signal filtering mechanism to substantially enhance trading precision and win rate.
一个信号可以是巧合。两个维度同时确认,就不是了。
One signal can be a coincidence. Two dimensions confirming simultaneously — that's not.
在交易里,最危险的事不是错过机会,而是在错误的信号上重仓进场。单一指标永远有盲点,单一周期永远有噪音。真正高胜率的交易,来自于多个维度同时指向同一个方向的那一刻。Confluence Pro Trading System · 共振进阶交易系统由财富俱乐部量化分析团队打造,专门捕捉这种多维度信号同时共振的关键时刻——把最高确信度的买卖机会,直接呈现在你的图表上。
In trading, the most dangerous thing is not missing an opportunity — it's entering heavily on a wrong signal. A single indicator always has blind spots. A single timeframe always has noise. Truly high-probability trades come from the moment when multiple dimensions simultaneously point in the same direction. The Confluence Pro Trading System · 共振进阶交易系统, built by the Wealth Club quantitative analysis team, is designed to capture exactly these moments — presenting the highest-confidence trading opportunities directly on your chart.
无需成为图表专家,强大的算法自动为你绘制所有关键信息。适用于股票、加密货币、外汇和商品等任何金融市场,支持1m、5m、15m、1h、4H、1D等所有主流时间框架。无论你是日内交易者、波段交易者还是趋势交易者,Confluence Pro都能为你捕捉最高确信度的入场时机,让你像机构一样进行交易。
No need to be a chart expert. Our powerful algorithm automatically plots all key information for you. Compatible with any financial market — stocks, crypto, forex, and commodities — across all major timeframes including 1m, 5m, 15m, 1h, 4H, and 1D. Whether you're a day trader, swing trader, or trend trader, Confluence Pro captures the highest-confidence entry opportunities so you can trade like an institution.
这套系统做了什么?
What does this system do?
财富俱乐部量化分析团队通过以下四个维度构建这套系统:
深度量化研究公司财务数据
K线与趋势技术指标分析
机构主力资金流向监测
大数据与AI驱动的多因子模型
The Wealth Club quantitative analysis team built this system across four dimensions:
In-depth quantitative research of company financial data
Candlestick and trend technical indicator analysis
Institutional capital flow monitoring
Big data and AI-driven multi-factor model
在上述四个维度的基础上,Confluence Pro系统额外整合了多时间框架共振度评分(Multi-Timeframe Confluence Score)与信号强度分级模型(Signal Conviction Grading)。前者是机构量化策略中用于过滤低质量信号的核心方法,通过日线、周线、月线多周期数据的叠加验证,只有当多个周期同时形成共振时,系统才输出信号;后者则将每一个信号按共振强度自动分为强、中、弱三个等级,帮助你根据信号质量精准调整仓位大小。
In addition to the four core dimensions, the Confluence Pro system further integrates a Multi-Timeframe Confluence Score and a Signal Conviction Grading Model. The former is a core method used in institutional quantitative strategies to filter low-quality signals — signals are only generated when daily, weekly, and monthly timeframes simultaneously confirm resonance. The latter automatically grades every signal into three conviction levels — strong, moderate, and weak — enabling precise position sizing based on signal quality.
Confluence Pro在图表上同时运行两套量化通道系统,各自独立追踪不同维度的市场数据。
Confluence Pro runs two quantitative channel systems simultaneously on your chart, each independently tracking a different dimension of market data.
第一套量化通道直接告诉你现在处于什么趋势环境——通道转为绿色,代表当前处于上升通道,趋势向上;通道转为红色,代表当前处于下降通道,趋势向下。你不需要判断,颜色已经告诉你答案。
The first quantitative channel tells you directly what trend environment you're in — when the channel turns green, you are in an uptrend; when it turns red, you are in a downtrend. No judgment needed — the color tells you the answer.
第二套量化通道实时追踪另一个维度的市场方向。当两套量化通道同时指向同一个方向,系统判定多维度共振成立,自动标出Buy或Sell信号。这就是共振的含义——两个维度同时说同一件事,信号的可信度才最高。
The second quantitative channel tracks market direction from another dimension. When both quantitative channels simultaneously point in the same direction, the system confirms multi-dimensional resonance and automatically marks a Buy or Sell signal. This is what resonance means — two dimensions saying the same thing at the same time, delivering the highest-confidence signal.
最终呈现在你面前的,只有两件事:图表上的BUY,和图表上的SELL。
What's presented to you is simple: BUY on the chart, and SELL on the chart.
🟢 绿色通道 → 上升趋势,买入信号
🟢 Green channel → Uptrend, buy signal
🔴 红色通道 → 下降趋势,卖出信号
🔴 Red channel → Downtrend, sell signal
订阅后即可解锁Confluence Pro完整使用指南,包括:
Subscribe to unlock the complete Confluence Pro usage guide, including:
如何判断两套量化通道共振的强弱程度,什么级别值得加大仓位进场,什么级别只适合轻仓试探。
How to judge the strength of two-channel resonance — what level warrants a larger position and what level only warrants a light test position.
哪个时间周期效果最好,日线、周线、小时线各有什么不同用法。
Which timeframe works best — how daily, weekly, and hourly charts each serve a different purpose.
通道颜色转变时的具体操作——绿色通道出现时应该如何布局,红色通道出现时应该如何应对。
Exactly what to do when the channel color changes — how to position when the green channel appears and how to respond when the red channel appears.
如何配合Auto Support & Resistance Trading System · 智能支撑压力交易系统的支撑位与压力位,以及Sigma · 顶底捕捉交易系统或Zone · 热度预警交易系统共同确认,形成更高胜率的交易系统。
How to combine with the support and resistance levels from the Auto Support & Resistance Trading System · 智能支撑压力交易系统, and confirmation from the Sigma · Top & Bottom Detection Trading System or Zone · Heat Alert Trading System, to build a higher win-rate trading system.
如何在TradingView上获得这个指标的专属授权,直接在你自己的账户上实时使用。
How to obtain exclusive TradingView access to run this indicator live in your own account.
25 套量化交易信号系统 · 完整交易生态系统
25 Quantitative Trading Signal Systems · A Complete Trading Ecosystem
交易系统均基于AI机器学习量化模型持续优化,系统数量将随优化进程动态调整。
All trading systems are continuously optimized through AI-driven machine learning and quantitative modelling. The number of systems is subject to change as optimization evolves.
我们提供的,从来不只是一套买卖信号工具。
What we offer has never been just a set of buy and sell signals.
Wealth Club 构建的是一个完整的交易生态系统——25 套量化买卖信号交易系统、深度研究报告、交易机会报告、核心持仓名单、高潜力名单、市场简报、市场前瞻与投资学堂,七大模块有机结合,覆盖从宏观研判到精准入场的完整交易闭环。
Wealth Club is built around a complete trading ecosystem — 25 quantitative signal trading systems, deep research reports, trading opportunity reports, core watchlist, high-potential watchlist, market briefs, market outlook, and investment academy. Seven integrated modules covering everything from macro analysis to precise entry execution — a complete trading loop.
订阅会员可获得完整访问权限,包括:
Subscribing members receive full access to:
交易机会报告
深度研究报告
潜力名单
核心名单
25 套专业交易系统完整使用权
Trading opportunity reports
Deep research reports
Potential watchlist
Core watchlist
Full access to all 25 professional trading systems
👉 查看完整使用指南:https://www.thewealthclub.vip/trading-system-confluence-trading-system/
👉 View Full Usage Guide: https://www.thewealthclub.vip/trading-system-confluence-trading-system/
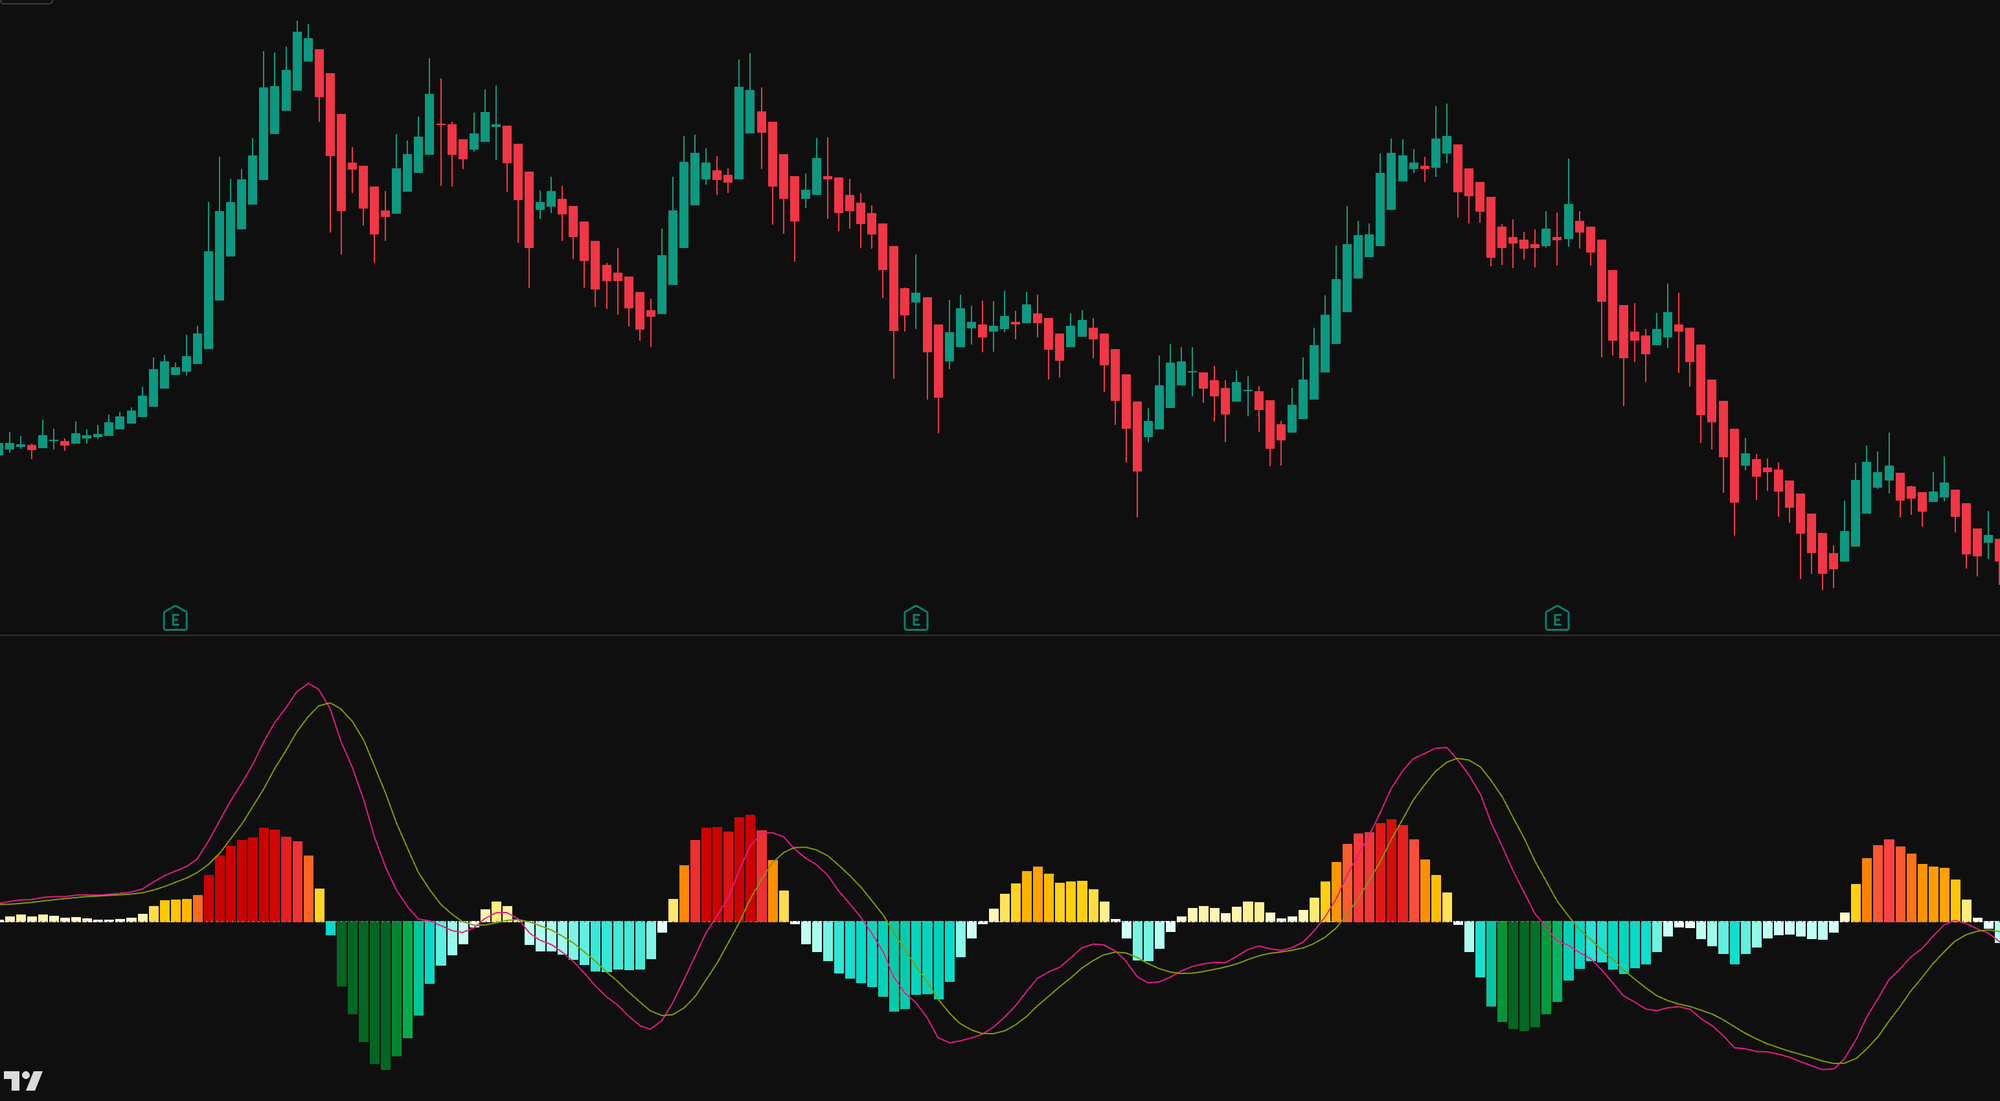
彩虹趋势交易系统 · Rainbow Trading System
【主图 · Main Chart】
以多层彩虹色动态趋势通道直观呈现市场趋势强度与方向,一眼判断趋势格局,让趋势交易变得简单清晰。
Displays market trend strength and direction through dynamic multi-layered rainbow trend channels — instantly read the trend landscape at a glance, making trend trading simple and crystal clear.
市场的动能,有强有弱。颜色,是最直觉的语言。
Market momentum has its highs and lows. Color is the most intuitive language.
数字和线条让人头痛,颜色让人一目了然。Rainbow Trading System · 彩虹趋势交易系统由财富俱乐部量化分析团队打造,把复杂的市场动能数据转化成直觉可读的彩虹渐变颜色——动能越强,颜色越深越鲜艳;动能越弱,颜色越浅越接近白色。不需要你解读任何数字,颜色已经把答案告诉你了。
Numbers and lines are hard to read. Colors are immediately clear. The Rainbow Trading System · 彩虹趋势交易系统, built by the Wealth Club quantitative analysis team, transforms complex market momentum data into intuitively readable rainbow gradient colors — the stronger the momentum, the deeper and more vivid the color; the weaker the momentum, the lighter and closer to white. You don't need to interpret any numbers — the color already tells you the answer.
无需成为图表专家,强大的算法自动为你绘制所有关键信息。适用于股票、加密货币、外汇和商品等任何金融市场,支持1m、5m、15m、1h、4H、1D等所有主流时间框架。无论你是日内交易者、波段交易者还是趋势交易者,Rainbow都能为你直觉化呈现市场动能强弱,让你像机构一样进行交易。
No need to be a chart expert. Our powerful algorithm automatically plots all key information for you. Compatible with any financial market — stocks, crypto, forex, and commodities — across all major timeframes including 1m, 5m, 15m, 1h, 4H, and 1D. Whether you're a day trader, swing trader, or trend trader, Rainbow intuitively presents market momentum strength so you can trade like an institution.
这套系统做了什么?
What does this system do?
财富俱乐部量化分析团队通过以下四个维度构建这套系统:
深度量化研究公司财务数据
K线与趋势技术指标分析
机构主力资金流向监测
大数据与AI驱动的多因子模型
The Wealth Club quantitative analysis team built this system across four dimensions:
In-depth quantitative research of company financial data
Candlestick and trend technical indicator analysis
Institutional capital flow monitoring
Big data and AI-driven multi-factor model
在上述四个维度的基础上,Rainbow系统额外整合了多周期趋势一致性评分(Multi-Period Trend Alignment Score)与周期共振强度分析(Cycle Resonance Intensity Analysis)。前者通过同时分析短线、中线、长线三个时间维度的趋势方向,量化三者之间的一致性程度——机构投资者将这种多周期趋势对齐视为最高置信度交易信号的前提条件;后者则追踪不同周期趋势之间共振的强弱程度,共振越强,趋势的可持续性越高,胜率也随之提升。
In addition to the four core dimensions, the Rainbow system further integrates a Multi-Period Trend Alignment Score and Cycle Resonance Intensity Analysis. The former simultaneously analyzes short-term, medium-term, and long-term trend directions to quantify their degree of alignment — institutional investors treat multi-period trend alignment as a prerequisite for the highest-confidence trade signals. The latter tracks the intensity of resonance between different timeframe trends; the stronger the resonance, the higher the trend's sustainability and the greater the probability of success.
Rainbow在副图上显示彩虹渐变柱状图和两条量化曲线。上方柱状图从白色渐变到深红,代表上涨动能从弱到强;下方柱状图从白色渐变到深绿,代表下跌动能从弱到强。两条曲线的走势和交叉,进一步确认动能的方向和强度。颜色越深,代表动能越强,趋势越稳固。
Rainbow displays a rainbow gradient histogram and two quantitative curves on the sub-chart. The upper histogram grades from white to deep red, representing upward momentum from weak to strong. The lower histogram grades from white to deep green, representing downward momentum from weak to strong. The movement and crossover of the two curves further confirm the direction and strength of momentum. The deeper the color, the stronger the momentum and the more stable the trend.
最终呈现在你面前的,只有一件事:颜色告诉你动能的强弱,曲线告诉你方向。
What's presented to you is simple: color tells you momentum strength, curves tell you direction.
订阅后即可解锁Rainbow完整使用指南,包括:
Subscribe to unlock the complete Rainbow usage guide, including:
不同颜色深浅对应的具体操作方法,深色和浅色代表完全不同的市场状态。
Exactly what each color depth means and the specific actions to take — deep and light colors represent completely different market states.
哪个时间周期效果最好,日线、周线、小时线各有什么不同用法。
Which timeframe works best — how daily, weekly, and hourly charts each serve a different purpose.
两条曲线和柱状图同时确认时,如何判断信号的可信度。
How to judge signal reliability when both the curves and histogram confirm simultaneously.
如何配合Auto Support & Resistance Trading System · 智能支撑压力交易系统的支撑位与压力位,以及Sigma · 顶底捕捉交易系统或Zone · 热度预警交易系统共同确认,形成更高胜率的交易系统。
How to combine with the support and resistance levels from the Auto Support & Resistance Trading System · 智能支撑压力交易系统, and confirmation from the Sigma · Top & Bottom Detection Trading System or Zone · Heat Alert Trading System, to build a higher win-rate trading system.
如何在TradingView上获得这个指标的专属授权,直接在你自己的账户上实时使用。
How to obtain exclusive TradingView access to run this indicator live in your own account.
25 套量化交易信号系统 · 完整交易生态系统
25 Quantitative Trading Signal Systems · A Complete Trading Ecosystem
交易系统均基于AI机器学习量化模型持续优化,系统数量将随优化进程动态调整。
All trading systems are continuously optimized through AI-driven machine learning and quantitative modelling. The number of systems is subject to change as optimization evolves.
我们提供的,从来不只是一套买卖信号工具。
What we offer has never been just a set of buy and sell signals.
Wealth Club 构建的是一个完整的交易生态系统——25 套量化买卖信号交易系统、深度研究报告、交易机会报告、核心持仓名单、高潜力名单、市场简报、市场前瞻与投资学堂,七大模块有机结合,覆盖从宏观研判到精准入场的完整交易闭环。
Wealth Club is built around a complete trading ecosystem — 25 quantitative signal trading systems, deep research reports, trading opportunity reports, core watchlist, high-potential watchlist, market briefs, market outlook, and investment academy. Seven integrated modules covering everything from macro analysis to precise entry execution — a complete trading loop.
订阅会员可获得完整访问权限,包括:
Subscribing members receive full access to:
交易机会报告
深度研究报告
潜力名单
核心名单
25 套专业交易系统完整使用权
Trading opportunity reports
Deep research reports
Potential watchlist
Core watchlist
Full access to all 25 professional trading systems
👉 查看完整使用指南:https://www.thewealthclub.vip/trading-system-rainbow-trading-system/
👉 View Full Usage Guide: https://www.thewealthclub.vip/trading-system-rainbow-trading-system/
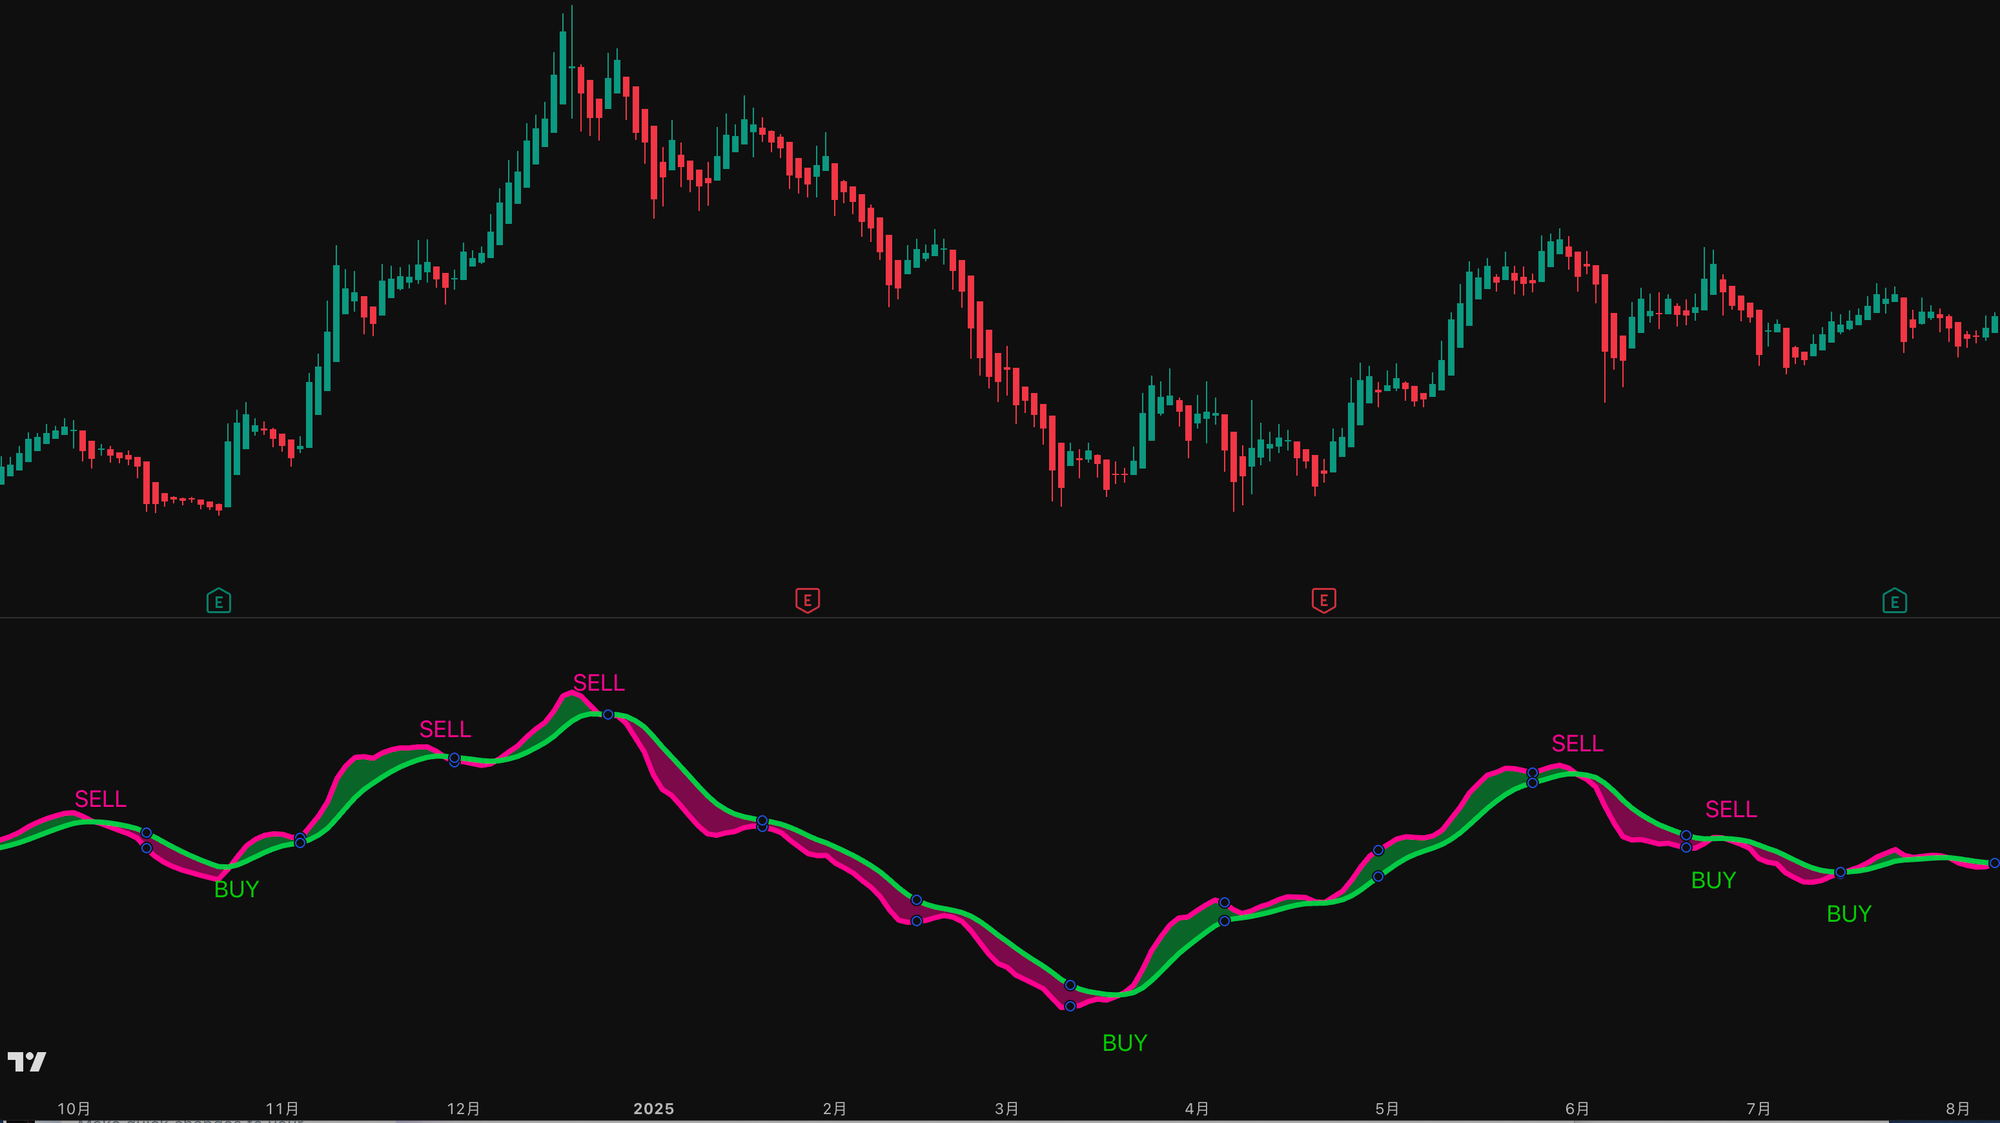
顺势交易系统 · Flow Trading System
【主图 · Main Chart】
顺应市场主力资金流向,实时追踪趋势动能与方向,让你始终与市场最强趋势同步前行,不再逆势而为。
Aligns with the dominant market money flow, tracking trend momentum and direction in real time — keeping you always in sync with the strongest market trend, never trading against the tide.
趋势就像水流。顺势而行的人赚钱,逆势而行的人亏钱。
Trends are like water. Those who flow with them profit. Those who fight them lose.
最难的不是判断趋势,而是判断趋势的转折点。Flow Trading System · 顺势交易系统由财富俱乐部量化分析团队打造,用两条量化动态轨道实时追踪趋势的方向和强度,在趋势转折的关键时刻自动发出信号。
The hardest part isn't identifying the trend — it's identifying the turning point. The Flow Trading System · 顺势交易系统, built by the Wealth Club quantitative analysis team, uses two quantitative dynamic tracks to track trend direction and strength in real time, automatically signaling at the critical moment when the trend turns.
无需成为图表专家,强大的算法自动为你绘制所有关键信息。适用于股票、加密货币、外汇和商品等任何金融市场,支持1m、5m、15m、1h、4H、1D等所有主流时间框架。无论你是日内交易者、波段交易者还是趋势交易者,Flow都能为你清晰追踪趋势方向,让你像机构一样进行交易。
No need to be a chart expert. Our powerful algorithm automatically plots all key information for you. Compatible with any financial market — stocks, crypto, forex, and commodities — across all major timeframes including 1m, 5m, 15m, 1h, 4H, and 1D. Whether you're a day trader, swing trader, or trend trader, Flow clearly tracks trend direction so you can trade like an institution.
这套系统做了什么?
What does this system do?
财富俱乐部量化分析团队通过以下四个维度构建这套系统:
深度量化研究公司财务数据
K线与趋势技术指标分析
机构主力资金流向监测
大数据与AI驱动的多因子模型
The Wealth Club quantitative analysis team built this system across four dimensions:
In-depth quantitative research of company financial data
Candlestick and trend technical indicator analysis
Institutional capital flow monitoring
Big data and AI-driven multi-factor model
在上述四个维度的基础上,Flow系统额外整合了主力资金净流向追踪(Smart Money Net Flow Tracking)与异常资金异动侦测算法(Abnormal Capital Movement Detection)。前者通过分析成交额、换手结构及大单买卖比例,量化机构主力资金的净流入与净流出;后者则通过机器学习模型持续扫描盘中资金行为,一旦出现偏离正常范围的异常资金流动,系统立即触发预警——这正是华尔街量化团队追踪"聪明钱"的核心方法之一。
In addition to the four core dimensions, the Flow system further integrates Smart Money Net Flow Tracking and an Abnormal Capital Movement Detection Algorithm. The former quantifies institutional net inflows and outflows by analyzing turnover structure and large-order buy/sell ratios. The latter uses machine learning models to continuously scan intraday capital behavior — the moment abnormal capital flows deviate from baseline patterns, the system triggers an alert. This is one of the core methods Wall Street quantitative teams use to track "smart money."
Flow在副图上显示两条颜色动态变化的量化轨道。当趋势向上,玫红线从下方穿越绿线向上交叉,两条轨道之间填充绿色色带,代表顺势做多,系统自动标出BUY信号;当趋势逆转,玫红线从上方穿越绿线向下,色带转为玫红色,代表趋势反转,系统自动标出SELL信号。色带的宽窄,直接反映当前趋势的强弱。
Flow displays two quantitative tracks with dynamic color changes on the sub-chart. When the trend is up, the rose-pink line crosses above the green line and a green band fills between them — and the system automatically marks a BUY signal. When the trend reverses, the rose-pink line crosses back below the green line, the band turns rose-pink, and the system marks a SELL signal. The width of the band directly reflects the strength of the current trend.
最终呈现在你面前的,只有两件事:图表上的BUY,和图表上的SELL。
What's presented to you is simple: BUY on the chart, and SELL on the chart.
🟢 绿色色带 → 顺势做多,买入机会
🟢 Green band → Bullish trend, buy opportunity
🩷 玫红色色带 → 趋势反转,卖出机会
🩷 Rose-pink band → Trend reversal, sell opportunity
订阅后即可解锁Flow完整使用指南,包括:
Subscribe to unlock the complete Flow usage guide, including:
色带转色时的具体进场和离场操作。
Exactly how to enter and exit when the color band changes.
哪个时间周期效果最好,日线、周线、小时线各有什么不同用法。
Which timeframe works best — how daily, weekly, and hourly charts each serve a different purpose.
如何判断色带宽窄的意义,宽色带和窄色带代表完全不同的市场状态。
How to judge the significance of band width — wide and narrow bands represent completely different market states.
如何配合Auto Support & Resistance Trading System · 智能支撑压力交易系统的支撑位与压力位,以及Sigma · 顶底捕捉交易系统或Zone · 热度预警交易系统共同确认,形成更高胜率的交易系统。
How to combine with the support and resistance levels from the Auto Support & Resistance Trading System · 智能支撑压力交易系统, and confirmation from the Sigma · Top & Bottom Detection Trading System or Zone · Heat Alert Trading System, to build a higher win-rate trading system.
如何在TradingView上获得这个指标的专属授权,直接在你自己的账户上实时使用。
How to obtain exclusive TradingView access to run this indicator live in your own account.
25 套量化交易信号系统 · 完整交易生态系统
25 Quantitative Trading Signal Systems · A Complete Trading Ecosystem
交易系统均基于AI机器学习量化模型持续优化,系统数量将随优化进程动态调整。
All trading systems are continuously optimized through AI-driven machine learning and quantitative modelling. The number of systems is subject to change as optimization evolves.
我们提供的,从来不只是一套买卖信号工具。
What we offer has never been just a set of buy and sell signals.
Wealth Club 构建的是一个完整的交易生态系统——25套量化买卖信号交易系统、深度研究报告、交易机会报告、核心持仓名单、高潜力名单、市场简报、市场前瞻与投资学堂,七大模块有机结合,覆盖从宏观研判到精准入场的完整交易闭环。
Wealth Club is built around a complete trading ecosystem — 25 quantitative signal trading systems, deep research reports, trading opportunity reports, core watchlist, high-potential watchlist, market briefs, market outlook, and investment academy. Seven integrated modules covering everything from macro analysis to precise entry execution — a complete trading loop.
订阅会员可获得完整访问权限,包括:
Subscribing members receive full access to:
交易机会报告
深度研究报告
潜力名单
核心名单
25 套专业交易系统完整使用权
Trading opportunity reports
Deep research reports
Potential watchlist
Core watchlist
Full access to all 25 professional trading systems
👉 查看完整使用指南:https://www.thewealthclub.vip/trading-system-flow-trading-system/
👉 View Full Usage Guide: https://www.thewealthclub.vip/trading-system-flow-trading-system/
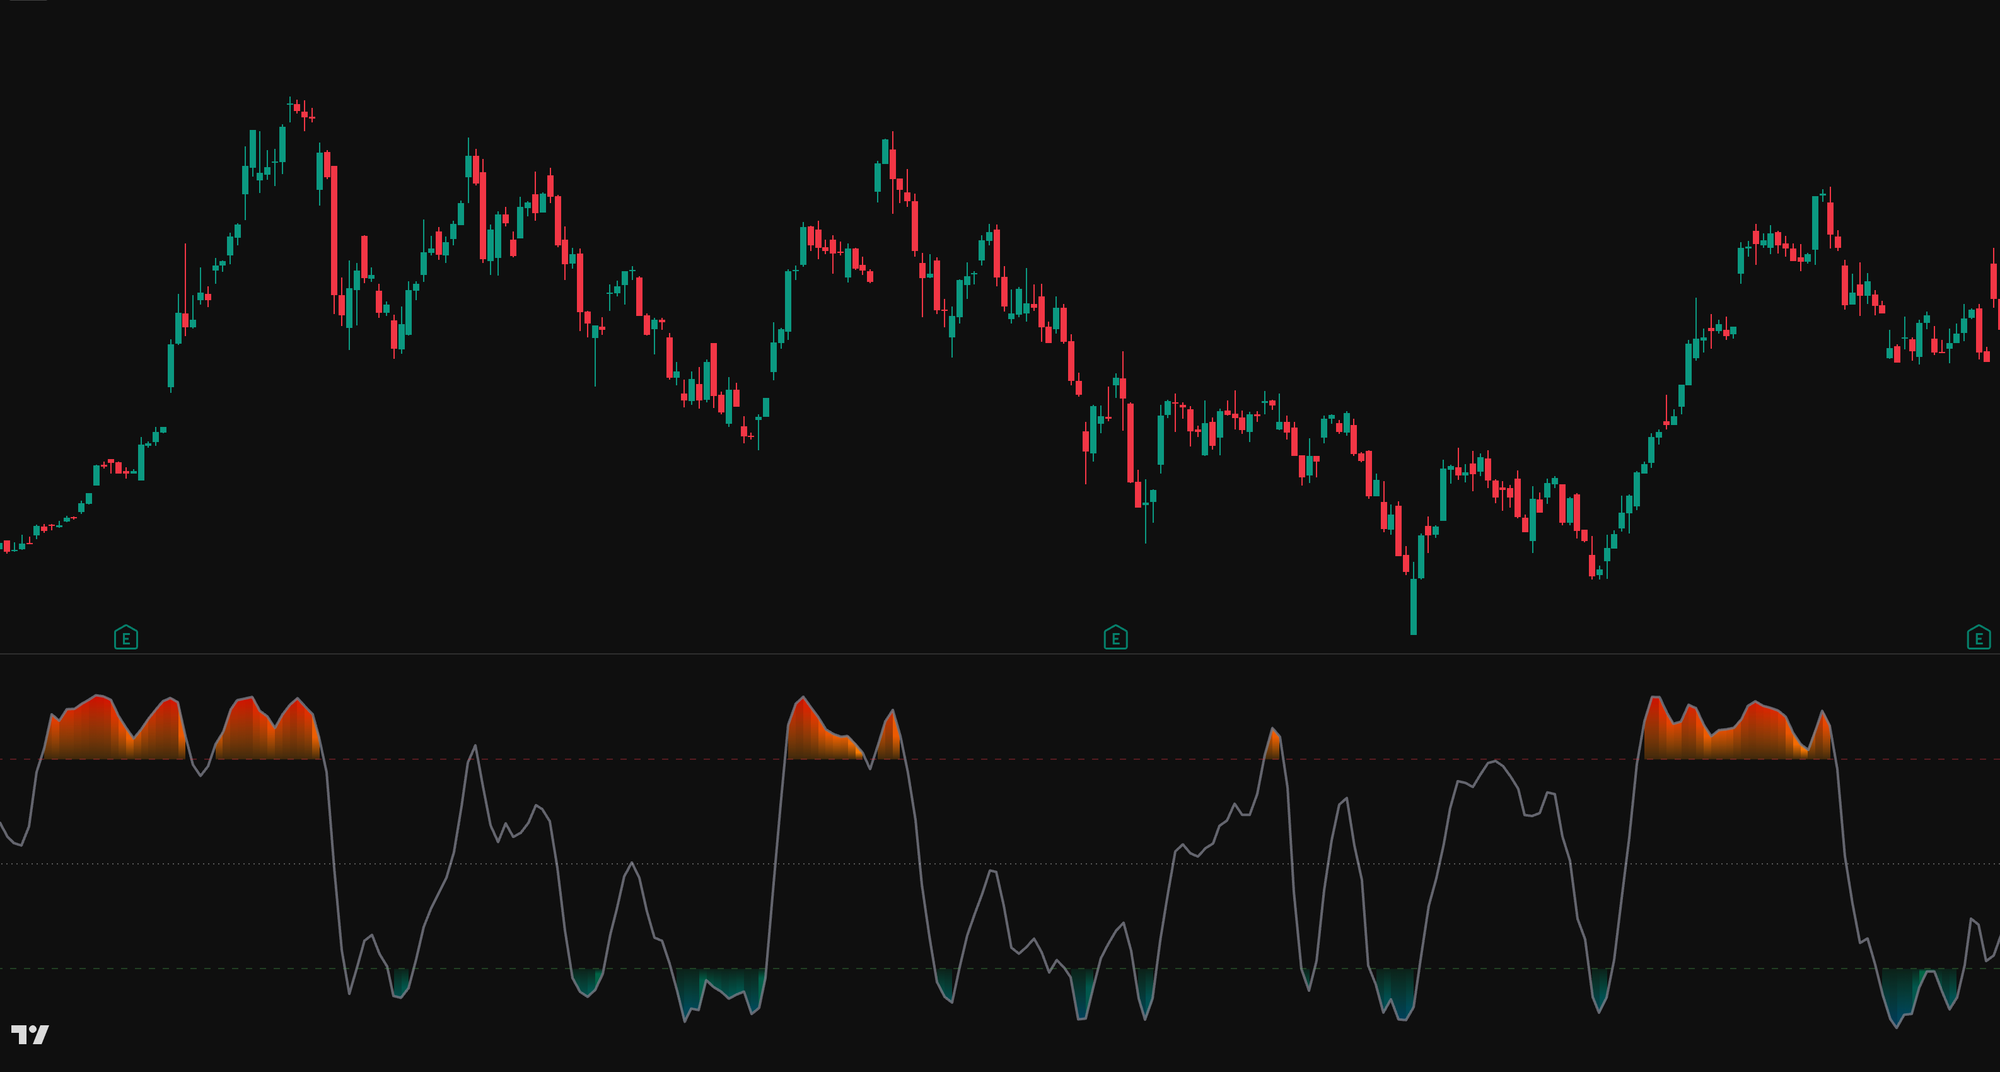
热度预警交易系统 · Zone Trading System
【主图 · Main Chart】
实时监测市场热度与情绪变化,在价格进入关键热度区域时提前预警,帮助交易者在市场情绪极端时做出理性决策。
Monitors market heat and sentiment shifts in real time, alerting you the moment price enters critical heat zones — helping traders make rational decisions when market emotions reach extremes.
市场有温度。懂得读懂温度的人,永远比别人早一步。
The market has a temperature. Those who know how to read it always stay one step ahead.
大多数交易者只看价格涨跌,却忽略了价格背后的温度信号——市场是过热了还是过冷了?Zone Trading System · 热度预警交易系统由财富俱乐部量化分析团队打造,用颜色直接告诉你市场现在的温度状态,让你在风险累积之前提前预警,在机会出现之前提前准备。
Most traders only look at price movements, ignoring the temperature signals behind the price. The Zone Trading System · 热度预警交易系统, built by the Wealth Club quantitative analysis team, uses color to tell you the market's current temperature state directly — warning you before risk accumulates, preparing you before opportunities emerge.
无需成为图表专家,强大的算法自动为你绘制所有关键信息。适用于股票、加密货币、外汇和商品等任何金融市场,支持1m、5m、15m、1h、4H、1D等所有主流时间框架。无论你是日内交易者、波段交易者还是趋势交易者,Zone都能为你实时监测市场温度,让你像机构一样进行交易。
No need to be a chart expert. Our powerful algorithm automatically plots all key information for you. Compatible with any financial market — stocks, crypto, forex, and commodities — across all major timeframes including 1m, 5m, 15m, 1h, 4H, and 1D. Whether you're a day trader, swing trader, or trend trader, Zone monitors market temperature in real time so you can trade like an institution.
这套系统做了什么?
What does this system do?
财富俱乐部量化分析团队通过以下四个维度构建这套系统:
深度量化研究公司财务数据
K线与趋势技术指标分析
机构主力资金流向监测
大数据与AI驱动的多因子模型
The Wealth Club quantitative analysis team built this system across four dimensions:
In-depth quantitative research of company financial data
Candlestick and trend technical indicator analysis
Institutional capital flow monitoring
Big data and AI-driven multi-factor model
在上述四个维度的基础上,Zone系统额外整合了市场情绪热度指数(Market Sentiment Heat Index)与隐含波动率结构监测(Implied Volatility Structure Monitoring)。前者通过聚合期权市场的认购/认沽比率、散户情绪数据及媒体热度指标,构建出一个实时的市场情绪温度计;后者则追踪隐含波动率(IV)的期限结构变化——当市场情绪过热而IV曲线出现异常时,Zone系统将提前发出风险预警。
In addition to the four core dimensions, the Zone system further integrates a Market Sentiment Heat Index and Implied Volatility Structure Monitoring. The former aggregates options market put/call ratios, retail sentiment data, and media heat metrics into a real-time market temperature gauge. The latter tracks changes in the implied volatility (IV) term structure — when market sentiment overheats and the IV curve shows anomalies, the Zone system issues a risk alert in advance.
Zone与其他系统最大的区别是:没有买卖信号,只有颜色。橙红色填充区代表市场过热,进入超买区间,风险正在累积;青绿色填充区代表市场过冷,进入超卖区间,机会正在积累。没有信号,没有提示,只有颜色——让你自己判断,自己决定。这种设计专为有经验的交易者而设,不需要系统告诉你买卖,你只需要知道市场的温度。
The biggest difference between Zone and every other system is: no buy or sell signals — only color. An orange-red fill means the market is overheating with risk accumulating. A teal-green fill means the market is too cold with opportunity accumulating. No signals, no alerts — just color. You judge. You decide. This design is made for experienced traders who don't need the system to tell them when to buy or sell — they just need to know the temperature.
最终呈现在你面前的,只有一件事:颜色告诉你温度,判断由你决定。
What's presented to you is simple: color tells you the temperature — the judgment is yours.
🟠 橙红色 → 市场过热,风险累积,注意卖出机会
🟠 Orange-red → Market overheating, risk accumulating, watch for sell opportunities
🟢 青绿色 → 市场过冷,机会累积,留意买入机会
🟢 Teal-green → Market too cold, opportunity accumulating, watch for buy opportunities
订阅后即可解锁Zone完整使用指南,包括:
Subscribe to unlock the complete Zone usage guide, including:
橙红色和青绿色填充区出现时的具体操作方法。
Exactly what to do when the orange-red and teal-green overlays appear.
哪个时间周期效果最好,日线、周线、小时线各有什么不同用法。
Which timeframe works best — how daily, weekly, and hourly charts each serve a different purpose.
如何判断填充区的深浅程度,深色和浅色代表的风险程度完全不同。
How to judge the depth of the overlay — deep and light colors represent completely different risk levels.
如何配合Auto Support & Resistance Trading System · 智能支撑压力交易系统的支撑位与压力位,以及主图系统共同确认,形成更高胜率的交易决策。
How to combine with the support and resistance levels from the Auto Support & Resistance Trading System · 智能支撑压力交易系统, and main-chart system confirmation, to build higher win-rate trading decisions.
如何在TradingView上获得这个指标的专属授权,直接在你自己的账户上实时使用。
How to obtain exclusive TradingView access to run this indicator live in your own account.
25 套量化交易信号系统 · 完整交易生态系统
25 Quantitative Trading Signal Systems · A Complete Trading Ecosystem
交易系统均基于AI机器学习量化模型持续优化,系统数量将随优化进程动态调整。
All trading systems are continuously optimized through AI-driven machine learning and quantitative modelling. The number of systems is subject to change as optimization evolves.
我们提供的,从来不只是一套买卖信号工具。
What we offer has never been just a set of buy and sell signals.
Wealth Club 构建的是一个完整的交易生态系统——25套量化买卖信号交易系统、深度研究报告、交易机会报告、核心持仓名单、高潜力名单、市场简报、市场前瞻与投资学堂,七大模块有机结合,覆盖从宏观研判到精准入场的完整交易闭环。
Wealth Club is built around a complete trading ecosystem — 25 quantitative signal trading systems, deep research reports, trading opportunity reports, core watchlist, high-potential watchlist, market briefs, market outlook, and investment academy. Seven integrated modules covering everything from macro analysis to precise entry execution — a complete trading loop.
订阅会员可获得完整访问权限,包括:
Subscribing members receive full access to:
交易机会报告
深度研究报告
潜力名单
核心名单
25 套专业交易系统完整使用权
Trading opportunity reports
Deep research reports
Potential watchlist
Core watchlist
Full access to all 25 professional trading systems
👉 查看完整使用指南:https://www.thewealthclub.vip/trading-system-zone-trading-system/
👉 View Full Usage Guide: https://www.thewealthclub.vip/trading-system-zone-trading-system/
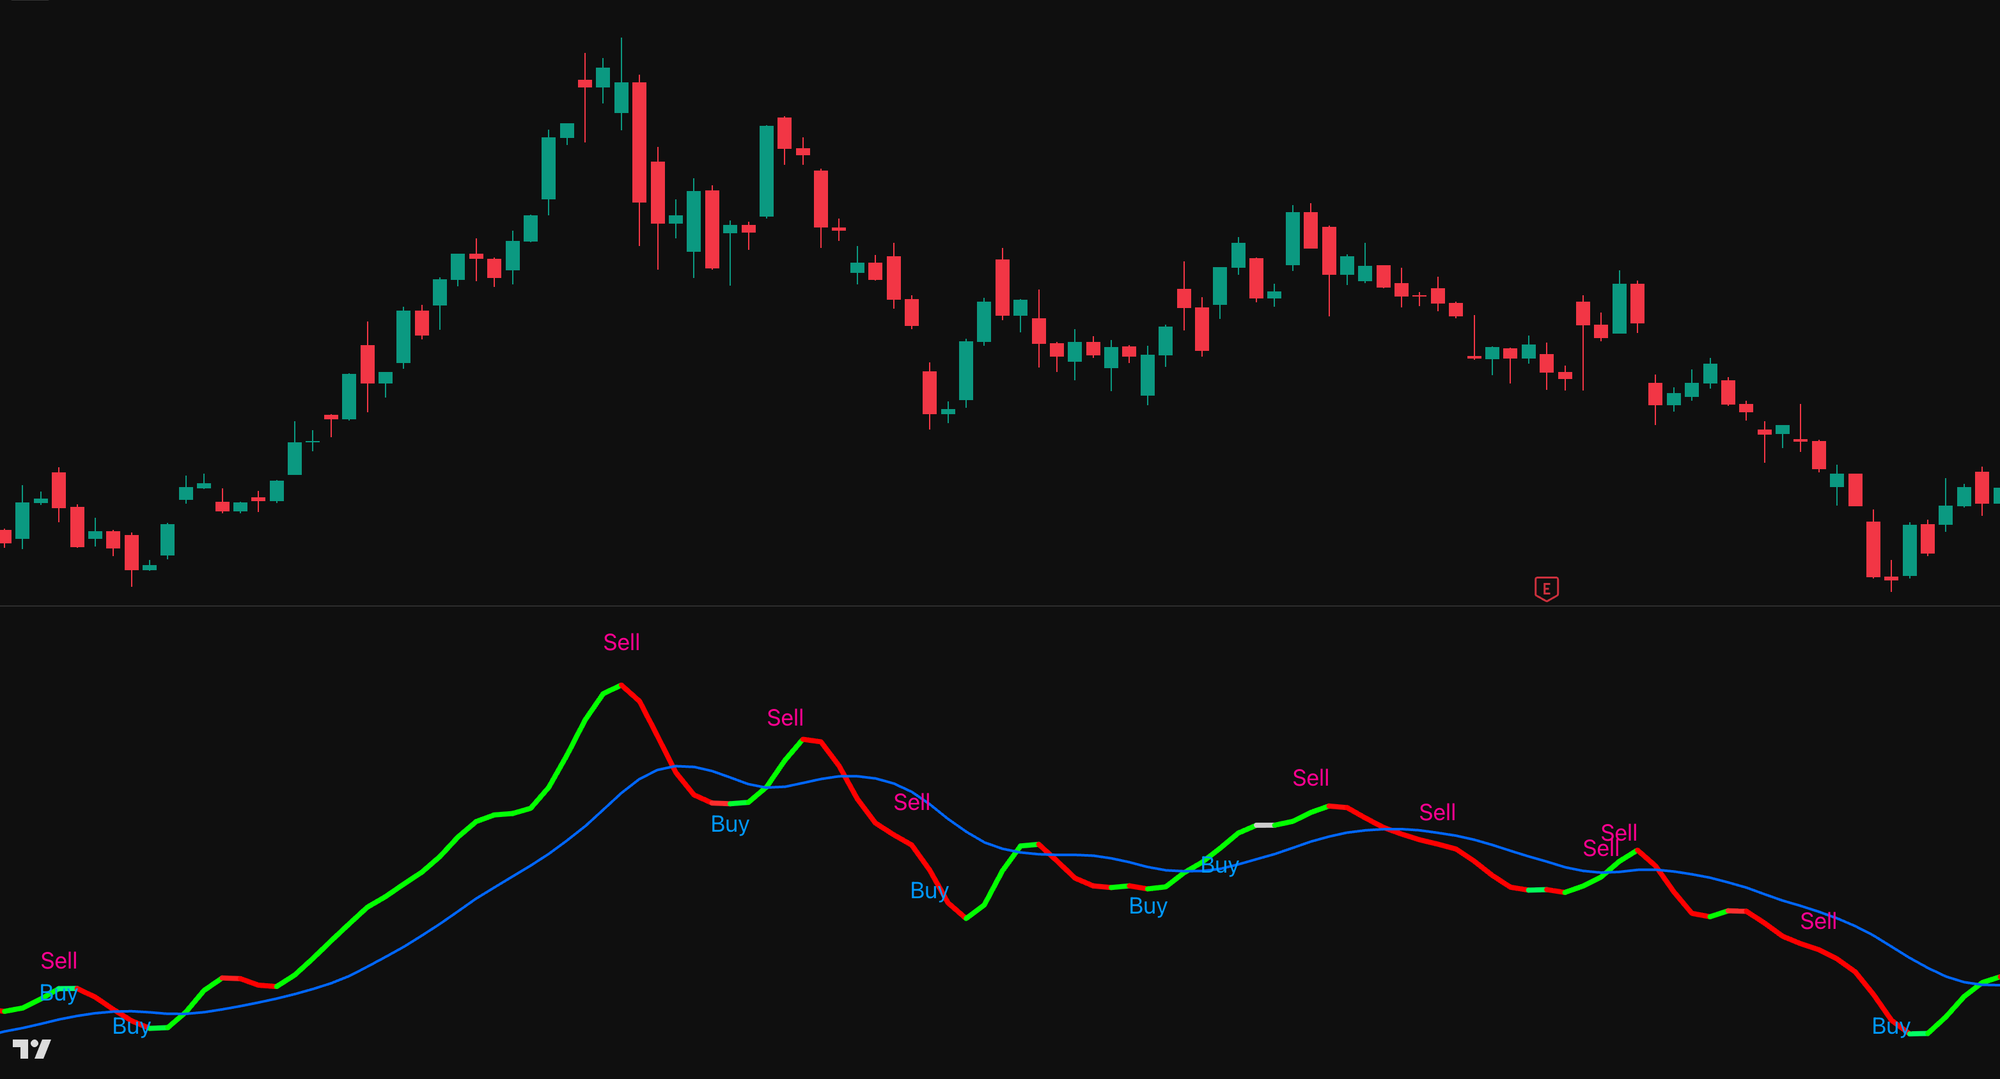
轨迹信号系统 · Trail Trading System
【主图 · Main Chart】
追踪价格运动轨迹与趋势留下的痕迹,趋势留下的痕迹就是最好的交易依据,精准锁定趋势延续与结束的关键节点。
Tracks the trajectory and footprints left by price movement — the trail a trend leaves behind is the best basis for trading, precisely locking onto the key nodes where a trend continues or ends.
趋势留下的痕迹,就是最好的交易依据。
The trail a trend leaves behind is the best basis for every trade.
价格每一根K线的背后,都有一条隐藏的轨迹——它记录着动能的方向,只是多数人看不见。Trail Trading System · 轨迹信号交易系统由财富俱乐部量化分析团队打造,把这条隐藏的轨迹直接呈现在副图上——用一条会变色的连续曲线,追踪市场动能的每一次切换,让趋势的来龙去脉一目了然。
Behind every candlestick lies a hidden trail — recording the direction of momentum, invisible to most. The Trail Trading System · 轨迹信号交易系统, built by the Wealth Club quantitative analysis team, brings this hidden trail directly to the sub-chart — a single color-changing continuous curve that tracks every shift in market momentum, making the story of the trend immediately clear.
无需成为图表专家,强大的算法自动为你绘制所有关键信息。适用于股票、加密货币、外汇和商品等任何金融市场,支持1m、5m、15m、1h、4H、1D等所有主流时间框架。无论你是日内交易者、波段交易者还是趋势交易者,Trail都能为你实时追踪市场动能的轨迹,让你像机构一样进行交易。
No need to be a chart expert. Our powerful algorithm automatically plots all key information for you. Compatible with any financial market — stocks, crypto, forex, and commodities — across all major timeframes including 1m, 5m, 15m, 1h, 4H, and 1D. Whether you're a day trader, swing trader, or trend trader, Trail tracks market momentum in real time so you can trade like an institution.
这套系统做了什么?
What does this system do?
财富俱乐部量化分析团队通过以下四个维度构建这套系统:
深度量化研究公司财务数据
K线与趋势技术指标分析
机构主力资金流向监测
大数据与AI驱动的多因子模型
The Wealth Club quantitative analysis team built this system across four dimensions:
In-depth quantitative research of company financial data
Candlestick and trend technical indicator analysis
Institutional capital flow monitoring
Big data and AI-driven multi-factor model
在上述四个维度的基础上,Trail系统额外整合了动能加速度评分(Momentum Acceleration Score)与价格结构线性回归模型(Price Structure Linear Regression)。前者通过量化动能在单位时间内的变化速率,精确识别动能正在加速还是减速;后者则通过机构级别的线性回归算法对价格结构进行平滑处理,过滤短期噪音,让轨迹线的颜色变化只反映真正有意义的动能切换。
In addition to the four core dimensions, the Trail system further integrates a Momentum Acceleration Score and a Price Structure Linear Regression Model. The former quantifies the rate of change of momentum over time, precisely identifying whether momentum is accelerating or decelerating. The latter applies institutional-grade linear regression to smooth price structure, filtering short-term noise so that color changes in the trail only reflect genuinely meaningful momentum shifts.
Trail在副图上显示两条核心曲线。轨迹线是系统的核心——绿色代表上涨动能,趋势向上;红色代表下跌动能,趋势向下。颜色的切换,就是动能方向改变的信号。蓝色基准线追踪中长期趋势的主方向,走势平稳,为轨迹线提供方向参考。
Trail displays two core curves on the sub-chart. The trail line is the system's core — green indicates upward momentum with the trend pointing up; red indicates downward momentum with the trend pointing down. The color shift is the signal that momentum direction has changed. The blue baseline tracks the primary medium-to-long-term trend direction with steady movement, providing directional context for the trail line.
最终呈现在你面前的,只有两件事:轨迹线的颜色,和基准线的方向。
What's presented to you is simple: the color of the trail line, and the direction of the baseline.
🟢 绿色轨迹线 → 上涨动能,买入机会
🟢 Green trail → Upward momentum, buy opportunity
🔴 红色轨迹线 → 下跌动能,卖出机会
🔴 Red trail → Downward momentum, sell opportunity
订阅后即可解锁Trail完整使用指南,包括:
Subscribe to unlock the complete Trail usage guide, including:
绿色和红色轨迹线的具体操作方法,以及三个不同入场时机的详细说明。
Exactly how to act on green and red trail lines, including detailed explanation of three distinct entry opportunities.
买卖信号出现在不同颜色线段上的最佳执行时机。
Optimal execution timing when buy and sell signals appear on different colored line segments.
轨迹线与蓝色基准线的位置关系如何判断趋势强弱。
How the position relationship between the trail line and the blue baseline indicates trend strength.
如何配合Auto Support & Resistance Trading System · 智能支撑压力交易系统的支撑位与压力位,以及Sigma · 顶底捕捉交易系统或Zone · 热度预警交易系统共同确认,形成更高胜率的交易系统。
How to combine with the support and resistance levels from the Auto Support & Resistance Trading System · 智能支撑压力交易系统, and confirmation from the Sigma · Top & Bottom Detection Trading System or Zone · Heat Alert Trading System, to build a higher win-rate trading system.
如何在TradingView上获得这个指标的专属授权,直接在你自己的账户上实时使用。
How to obtain exclusive TradingView access to run this indicator live in your own account.
25 套量化交易信号系统 · 完整交易生态系统
25 Quantitative Trading Signal Systems · A Complete Trading Ecosystem
交易系统均基于AI机器学习量化模型持续优化,系统数量将随优化进程动态调整。
All trading systems are continuously optimized through AI-driven machine learning and quantitative modelling. The number of systems is subject to change as optimization evolves.
我们提供的,从来不只是一套买卖信号工具。
What we offer has never been just a set of buy and sell signals.
Wealth Club 构建的是一个完整的交易生态系统——25 套量化买卖信号交易系统、深度研究报告、交易机会报告、核心持仓名单、高潜力名单、市场简报、市场前瞻与投资学堂,七大模块有机结合,覆盖从宏观研判到精准入场的完整交易闭环。
Wealth Club is built around a complete trading ecosystem — 25 quantitative signal trading systems, deep research reports, trading opportunity reports, core watchlist, high-potential watchlist, market briefs, market outlook, and investment academy. Seven integrated modules covering everything from macro analysis to precise entry execution — a complete trading loop.
订阅会员可获得完整访问权限,包括:
Subscribing members receive full access to:
交易机会报告
深度研究报告
潜力名单
核心名单
25 套专业交易系统完整使用权
Trading opportunity reports
Deep research reports
Potential watchlist
Core watchlist
Full access to all 25 professional trading systems
👉 查看完整使用指南:https://www.thewealthclub.vip/trading-system-trail-trading-system/
👉 View Full Usage Guide: https://www.thewealthclub.vip/trading-system-trail-trading-system/
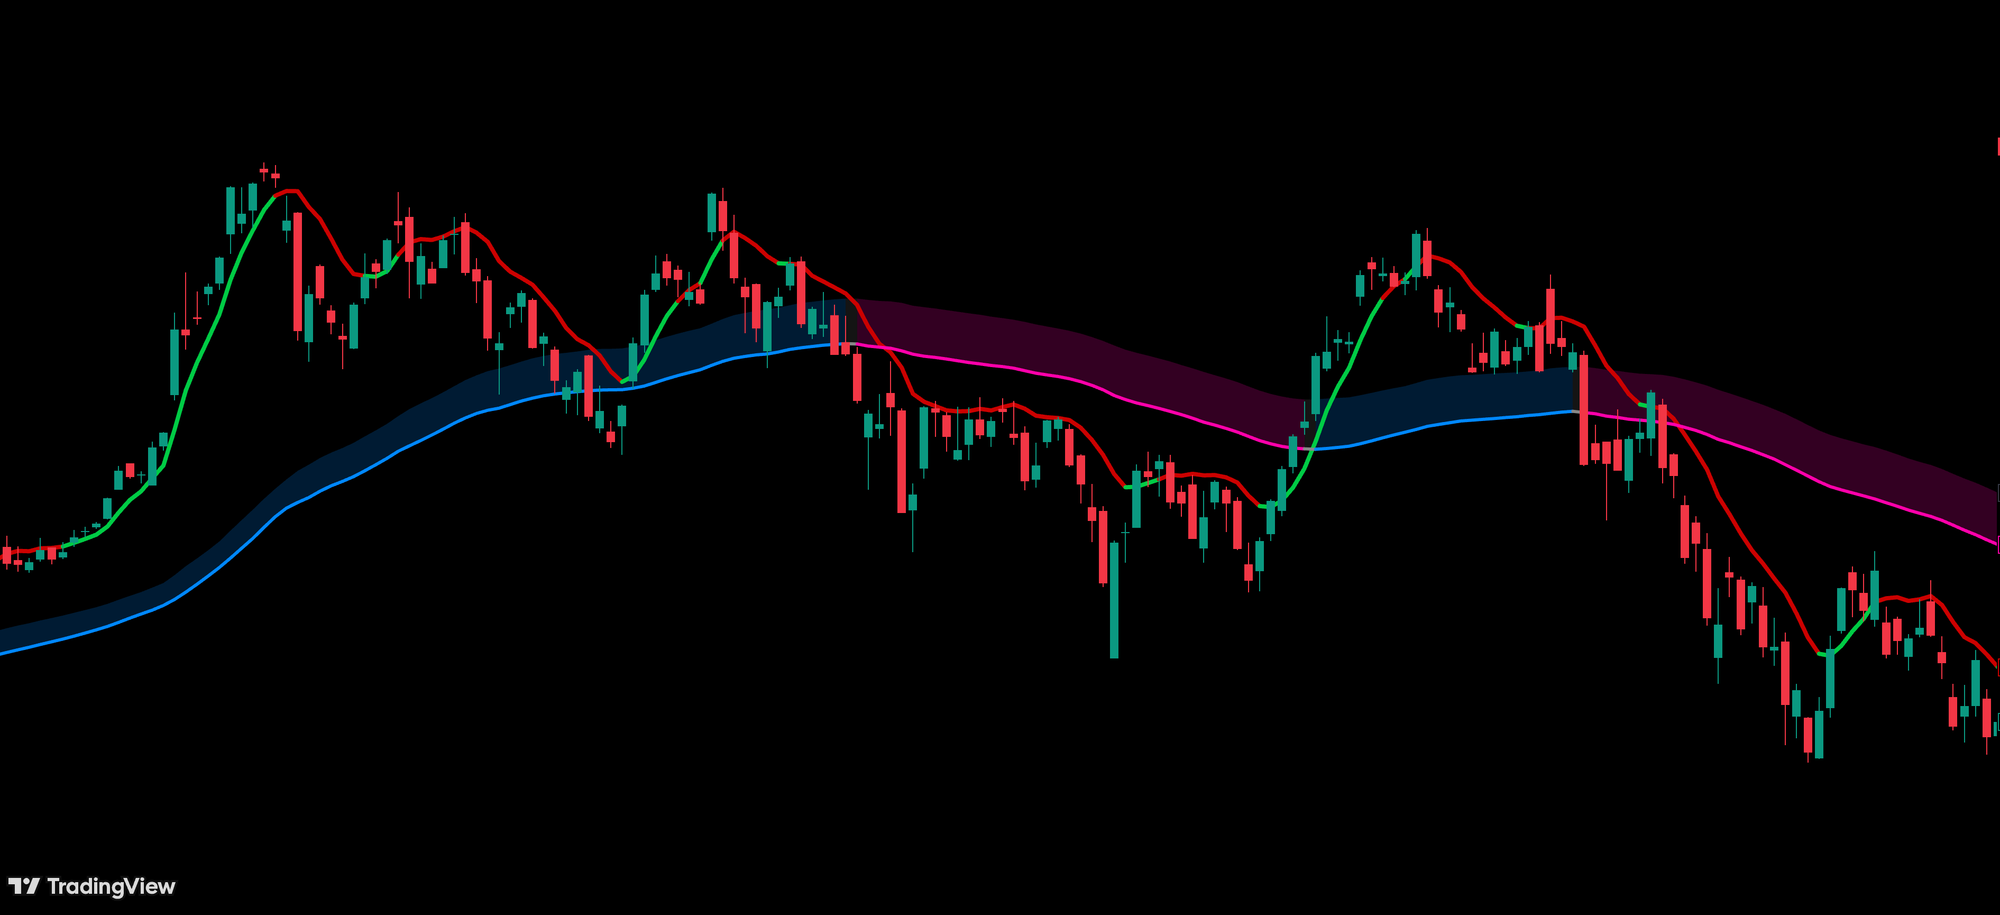
顶点交易系统 · Apex Trading System
【主图 · Main Chart】
精准锁定市场价格运动的顶点位置,在趋势到达极值的关键时刻发出信号,帮助交易者在最优位置及时止盈或反向布局。
Precisely locks onto the apex of market price movements, generating signals at the critical moment when a trend reaches its extreme — helping traders take profit or position in the opposite direction at the optimal point.
有些人不需要系统告诉他们买卖。他们只需要看见方向。
Some traders don't need the system to tell them when to buy or sell. They just need to see the direction.
大多数指标把图表塞得满满当当——线条、信号、颜色、标注,信息过载反而让判断更难。Apex Trading System · 顶点交易系统由财富俱乐部量化分析团队打造,把复杂的多维度市场分析浓缩成图表上两套量化通道——没有多余的噪音,没有强迫你执行的信号,只有最干净的市场方向。
Most indicators clutter the chart with lines, signals, colors, and labels — information overload that actually makes decision-making harder. The Apex Trading System · 顶点交易系统, built by the Wealth Club quantitative analysis team, condenses complex multi-dimensional market analysis into two quantitative channels on the chart — no extra noise, no forced signals, just the cleanest possible view of market direction.
无需成为图表专家,强大的算法自动为你绘制所有关键信息。适用于股票、加密货币、外汇和商品等任何金融市场,支持1m、5m、15m、1h、4H、1D等所有主流时间框架。无论你是日内交易者、波段交易者还是趋势交易者,Apex都能为你更清晰地展示市场方向,让你像机构一样进行交易。
No need to be a chart expert. Our powerful algorithm automatically plots all key information for you. Compatible with any financial market — stocks, crypto, forex, and commodities — across all major timeframes including 1m, 5m, 15m, 1h, 4H, and 1D. Whether you're a day trader, swing trader, or trend trader, Apex gives you a clearer view of market direction so you can trade like an institution.
这套系统做了什么?
What does this system do?
财富俱乐部量化分析团队通过以下四个维度构建这套系统:
深度量化研究公司财务数据
K线与趋势技术指标分析
机构主力资金流向监测
大数据与AI驱动的多因子模型
The Wealth Club quantitative analysis team built this system across four dimensions:
In-depth quantitative research of company financial data
Candlestick and trend technical indicator analysis
Institutional capital flow monitoring
Big data and AI-driven multi-factor model
在上述四个维度的基础上,Apex系统额外整合了趋势持续性因子(Trend Persistence Factor)与多周期结构共振评分(Multi-Period Structure Resonance Score)。前者来源于机构量化研究中评估趋势生命周期的核心模型,用于判断当前趋势是处于初期、中期还是衰竭阶段;后者则同时分析短线、中线、长线三个时间维度的结构共振程度,只有当多个周期同时形成方向一致的共振时,通道颜色才会发生切换。
In addition to the four core dimensions, the Apex system further integrates a Trend Persistence Factor and a Multi-Period Structure Resonance Score. The former is derived from institutional quantitative models used to assess trend lifecycle — identifying whether a trend is in its early, mid, or exhaustion phase. The latter simultaneously analyzes structure resonance across short-term, medium-term, and long-term dimensions — the channel color only shifts when multiple timeframes simultaneously form directionally aligned resonance.
Apex在主图上同时运行两套独立的量化通道。短周期动能线对价格变化高度敏感,率先反映趋势方向的切换——线条呈绿色代表短期趋势向上,呈红色代表短期趋势向下。大周期量化通道追踪中长期趋势结构,走势平稳,只在市场结构发生实质性改变时才改变颜色——通道填充蓝色代表中长期趋势持续向上,填充紫红色代表中长期趋势持续向下。
Apex runs two independent quantitative channels simultaneously on the main chart. The short-cycle momentum line is highly sensitive to price changes and first to reflect trend direction shifts — green indicates an upward short-term trend, red indicates a downward trend. The large-cycle quantitative channel tracks medium-to-long-term trend structure with steady movement, changing color only when the underlying market structure undergoes a genuine shift — blue fill means the medium-to-long-term trend is sustainably rising, dark purple-red fill means it is declining.
最终呈现在你面前的,只有两件事:短周期线的颜色,和大周期通道的颜色。
What's presented to you is simple: the color of the short-cycle line, and the color of the large-cycle channel.
🟢 绿色 → 买入信号
🟢 Green → Buy signal
🔴 红色 → 卖出信号
🔴 Red → Sell signal
订阅后即可解锁Apex完整使用指南,包括:
Subscribe to unlock the complete Apex usage guide, including:
短周期线和大周期通道如何配合使用,两套通道共振时的具体操作方法。
How to use the short-cycle line and large-cycle channel together, and how to act when both channels resonate.
哪个时间周期效果最好,日线、周线、小时线各有什么不同用法。
Which timeframe works best — how daily, weekly, and hourly charts each serve a different purpose.
短周期线转色但大周期通道未跟上时,应该入场还是等待。
When the short-cycle line changes color but the large-cycle channel hasn't followed — should you enter or wait?
如何配合Auto Support & Resistance Trading System · 智能支撑压力交易系统的支撑位与压力位,以及Sigma · 顶底捕捉交易系统或Zone · 热度预警交易系统共同确认,形成更高胜率的交易系统。
How to combine with the support and resistance levels from the Auto Support & Resistance Trading System · 智能支撑压力交易系统, and confirmation from the Sigma · Top & Bottom Detection Trading System or Zone · Heat Alert Trading System, to build a higher win-rate trading system.
如何在TradingView上获得这个指标的专属授权,直接在你自己的账户上实时使用。
How to obtain exclusive TradingView access to run this indicator live in your own account.
25 套量化交易信号系统 · 完整交易生态系统
25 Quantitative Trading Signal Systems · A Complete Trading Ecosystem
交易系统均基于AI机器学习量化模型持续优化,系统数量将随优化进程动态调整。
All trading systems are continuously optimized through AI-driven machine learning and quantitative modelling. The number of systems is subject to change as optimization evolves.
我们提供的,从来不只是一套买卖信号工具。
What we offer has never been just a set of buy and sell signals.
Wealth Club 构建的是一个完整的交易生态系统——25 套量化买卖信号交易系统、深度研究报告、交易机会报告、核心持仓名单、高潜力名单、市场简报、市场前瞻与投资学堂,七大模块有机结合,覆盖从宏观研判到精准入场的完整交易闭环。
Wealth Club is built around a complete trading ecosystem — 25 quantitative signal trading systems, deep research reports, trading opportunity reports, core watchlist, high-potential watchlist, market briefs, market outlook, and investment academy. Seven integrated modules covering everything from macro analysis to precise entry execution — a complete trading loop.
订阅会员可获得完整访问权限,包括:
Subscribing members receive full access to:
交易机会报告
深度研究报告
潜力名单
核心名单
25 套专业交易系统完整使用权
Trading opportunity reports
Deep research reports
Potential watchlist
Core watchlist
Full access to all 25 professional trading systems
👉 查看完整使用指南:https://www.thewealthclub.vip/trading-system-apex-trading-system/
👉 View Full Usage Guide: https://www.thewealthclub.vip/trading-system-apex-trading-system/
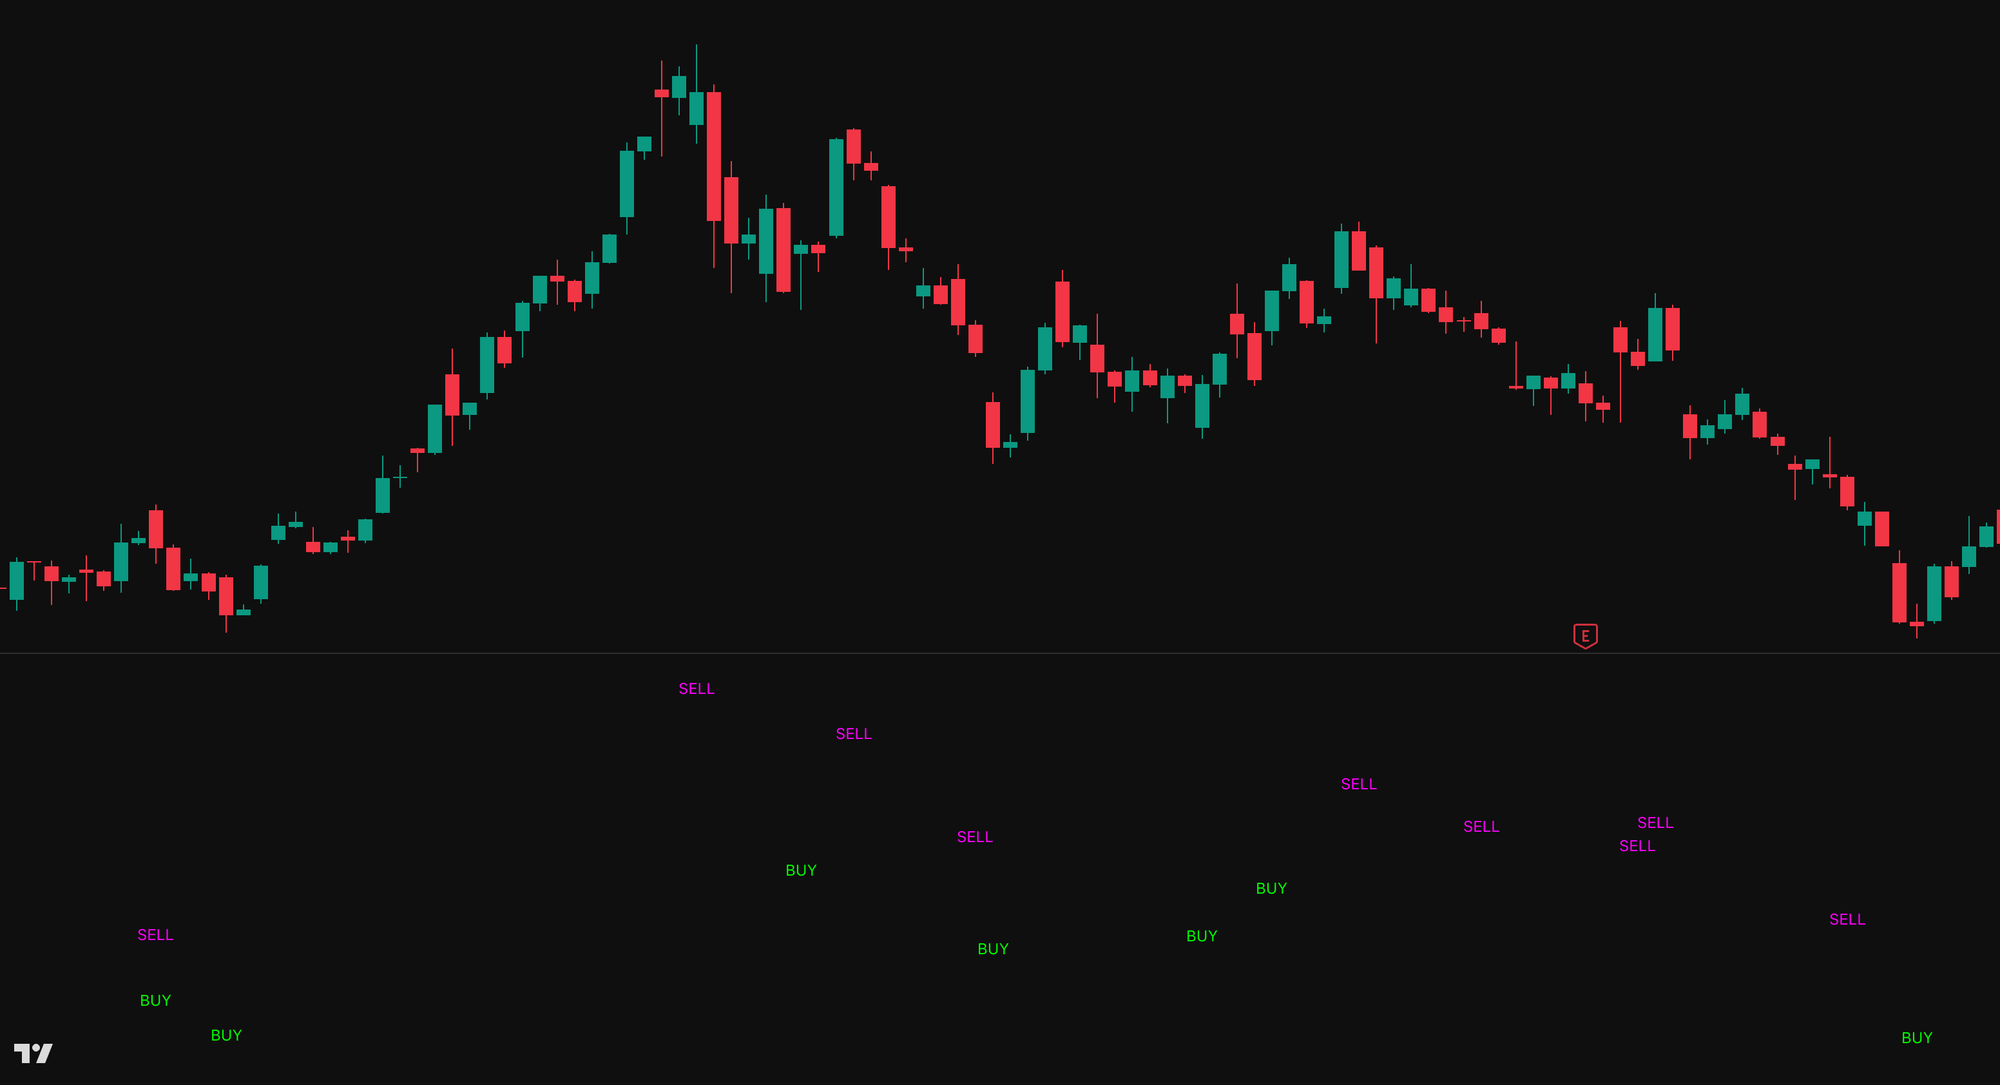
雷达交易系统 · Radar Trading System
【主图 · Main Chart】
如雷达般全方位扫描市场关键信号,只在真正有意义的转折点才发出信号,让你的注意力只集中在最重要的交易机会上。
Scans the market for key signals in all directions like a radar — only triggering at truly meaningful turning points, keeping your focus exclusively on the most important trading opportunities.
雷达不会一直响。只有目标出现的时候,它才发出信号。
Radar doesn't sound all the time. It only signals when a target appears.
大多数指标的问题是信号太多——市场震荡的时候也在不停地给信号,让人无所适从。Radar Trading System · 雷达交易系统由财富俱乐部量化分析团队打造,只在真正有意义的转折点才发出信号,其余时间保持沉默,让你的注意力只集中在最重要的位置。
The problem with most indicators is too many signals. The Radar Trading System · 雷达交易系统, built by the Wealth Club quantitative analysis team, only signals at truly meaningful turning points, staying silent the rest of the time, so your attention is focused only on what matters most.
无需成为图表专家,强大的算法自动为你识别所有关键信号。适用于股票、加密货币、外汇和商品等任何金融市场,支持1m、5m、15m、1h、4H、1D等所有主流时间框架。无论你是日内交易者、波段交易者还是趋势交易者,Radar都能为你过滤噪音,只在真正重要的时刻发出信号,让你像机构一样进行交易。
No need to be a chart expert. Our powerful algorithm automatically identifies all key signals for you. Compatible with any financial market — stocks, crypto, forex, and commodities — across all major timeframes including 1m, 5m, 15m, 1h, 4H, and 1D. Whether you're a day trader, swing trader, or trend trader, Radar filters out the noise and only signals when it truly matters so you can trade like an institution.
这套系统做了什么?
What does this system do?
财富俱乐部量化分析团队通过以下四个维度构建这套系统:
深度量化研究公司财务数据
K线与趋势技术指标分析
机构主力资金流向监测
大数据与AI驱动的多因子模型
The Wealth Club quantitative analysis team built this system across four dimensions:
In-depth quantitative research of company financial data
Candlestick and trend technical indicator analysis
Institutional capital flow monitoring
Big data and AI-driven multi-factor model
在上述四个维度的基础上,Radar系统额外整合了多价格区间异动扫描引擎(Multi-Zone Anomaly Scanning Engine)与相对成交量异常评分(Relative Volume Anomaly Score,RVOL)。前者模拟机构级别的盘口扫描逻辑,同时追踪多个关键价格区间的异常波动,实现"全场雷达式"覆盖;RVOL则是对冲基金量化筛选中的标准因子,通过对比当前成交量与历史平均水平,精确识别异常交投活跃度,提前捕捉主力介入的迹象。
In addition to the four core dimensions, the Radar system further integrates a Multi-Zone Anomaly Scanning Engine and a Relative Volume Anomaly Score (RVOL). The former replicates institutional-grade order book scanning logic, simultaneously monitoring multiple key price zones for abnormal activity in a full-market radar sweep. RVOL is a standard factor in hedge fund quantitative screening — by comparing current volume against historical averages, it precisely identifies abnormal trading activity and detects early signs of institutional accumulation.
Radar是视觉上最干净的副图系统。副图上没有任何线条,没有柱状图,没有填色,什么都没有。只有一件事:在关键转折点自动浮现的BUY和SELL信号。空白的副图就像雷达屏幕,平时一片安静,只有目标出现的时候才发出信号。
Radar is the cleanest sub-chart system in the suite. No lines, no histogram, no color fills on the sub-chart. Just one thing: BUY and SELL signals that automatically appear at key turning points. The blank sub-chart is like a radar screen — silent most of the time, signaling only when a target appears.
最终呈现在你面前的,只有两件事:图表上的BUY,和图表上的SELL。
What's presented to you is simple: BUY on the chart, and SELL on the chart.
订阅后即可解锁Radar完整使用指南,包括:
Subscribe to unlock the complete Radar usage guide, including:
BUY和SELL信号出现后的具体执行方法,包括仓位管理。
Exactly how to execute after a BUY or SELL signal appears, including position sizing.
哪个时间周期效果最好,日线、周线、小时线各有什么不同用法。
Which timeframe works best — how daily, weekly, and hourly charts each serve a different purpose.
如何判断信号的可信度,什么情况下信号应该忽略。
How to judge signal reliability and when a signal should be ignored.
如何配合Auto Support & Resistance Trading System · 智能支撑压力交易系统的支撑位与压力位,以及主图系统和其他副图系统共同确认,形成更高胜率的交易系统。
How to combine with the support and resistance levels from the Auto Support & Resistance Trading System · 智能支撑压力交易系统, and confirmation from the main-chart system and other sub-chart systems, to build a higher win-rate trading system.
如何在TradingView上获得这个指标的专属授权,直接在你自己的账户上实时使用。
How to obtain exclusive TradingView access to run this indicator live in your own account.
25套量化交易信号系统 · 完整交易生态系统
25 Quantitative Trading Signal Systems · A Complete Trading Ecosystem
交易系统均基于AI机器学习量化模型持续优化,系统数量将随优化进程动态调整。
All trading systems are continuously optimized through AI-driven machine learning and quantitative modelling. The number of systems is subject to change as optimization evolves.
我们提供的,从来不只是一套买卖信号工具。
What we offer has never been just a set of buy and sell signals.
Wealth Club 构建的是一个完整的交易生态系统——25套量化买卖信号交易系统、深度研究报告、交易机会报告、核心持仓名单、高潜力名单、市场简报、市场前瞻与投资学堂,七大模块有机结合,覆盖从宏观研判到精准入场的完整交易闭环。
Wealth Club is built around a complete trading ecosystem — 25 quantitative signal trading systems, deep research reports, trading opportunity reports, core watchlist, high-potential watchlist, market briefs, market outlook, and investment academy. Seven integrated modules covering everything from macro analysis to precise entry execution — a complete trading loop.
订阅会员可获得完整访问权限,包括:
Subscribing members receive full access to:
交易机会报告
深度研究报告
潜力名单
核心名单
25套专业交易系统完整使用权
Trading opportunity reports
Deep research reports
Potential watchlist
Core watchlist
Full access to all 25 professional trading systems
👉 查看完整使用指南:https://www.thewealthclub.vip/rtrading-system-radar-trading-system/
👉 View Full Usage Guide: https://www.thewealthclub.vip/rtrading-system-radar-trading-system/